🌍 Public
Scatter Plot with Menus
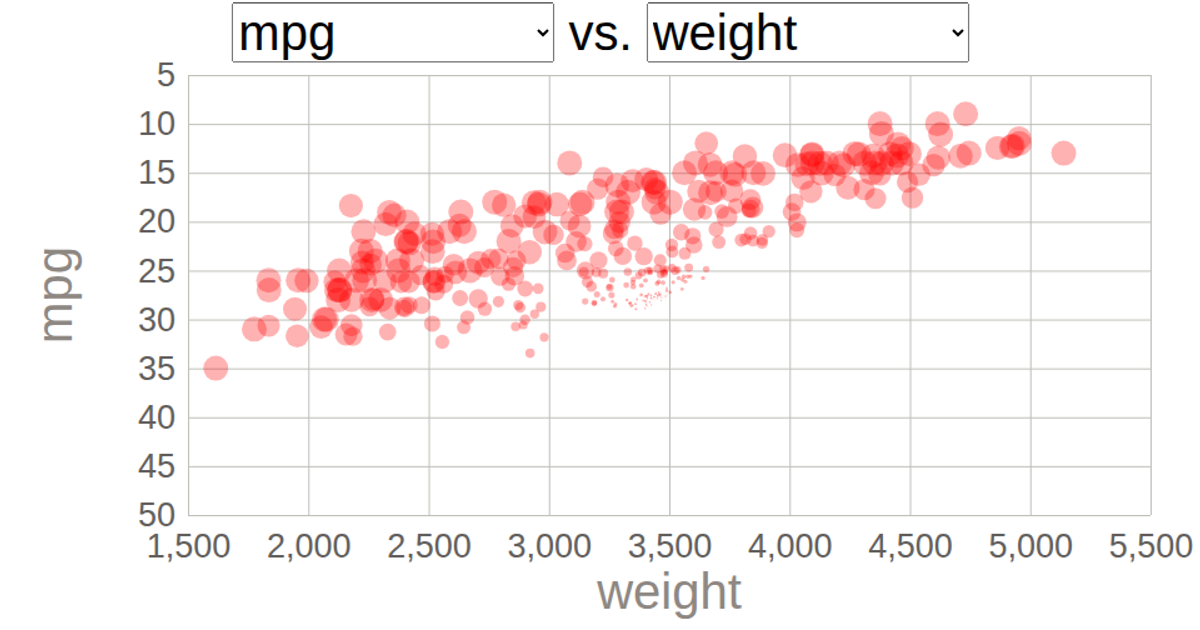
Two dropdown menus let the viewer choose which quantitative column from the dataset maps to the x- and y-axes of a scatter plot. Initially, the chart displays weight against mpg, but selecting a different column updates the corresponding axis and re-renders the circles with a staggered 2-second transition using D3 v5’s `transition().duration()` and `delay()`. The code uses `d3.csv`, `d3.scaleLinear`, `d3.axisBottom`, and `d3.axisLeft` in an SVG-based visualization.
AI-generated descriptionD3 course follow along.
MIT Licensed




Comments
Sign in to join the discussion.