🌍 Public
Sean Thornton MA Unemployment
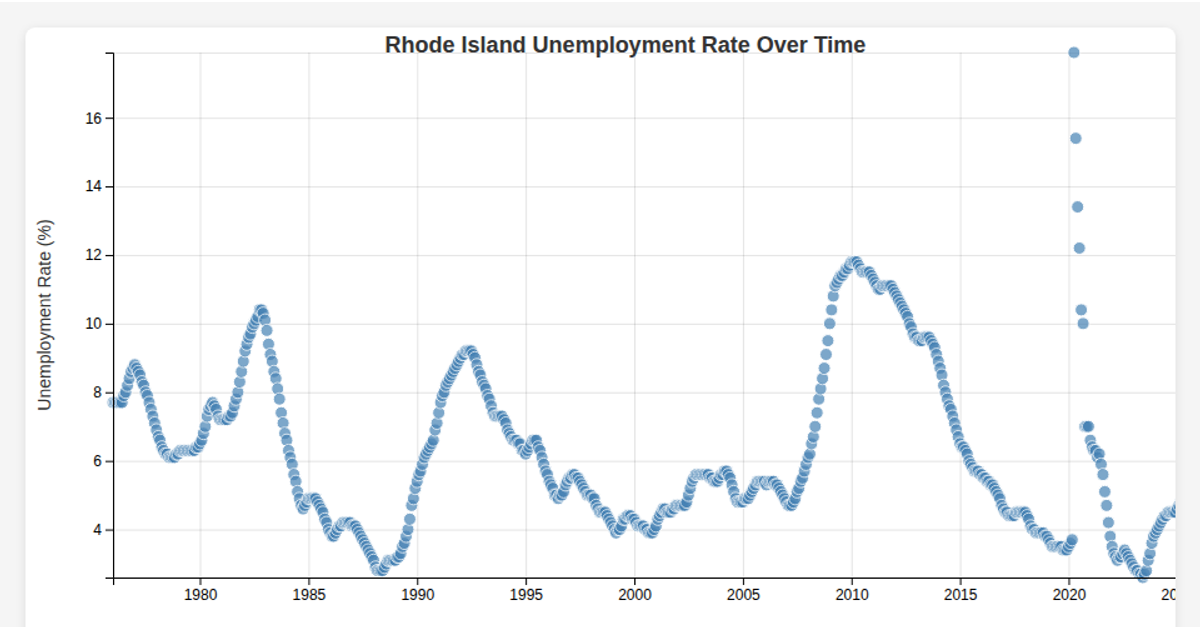
This example displays the monthly unemployment rate in Massachusetts from 1976 to 2003, with data sourced from the Federal Reserve Economic Data (FRED) series MAUR. The visualization loads a CSV file via `fetch` and parses it with `d3.csvParse`, then renders the raw data as text in a `<pre>` element using D3’s `select` and data join. The code relies on D3 v7 and a simple state management pattern to handle the asynchronous loading process.
AI-generated descriptionhttps://fred.stlouisfed.org/series/MAUR
I found this with a search on https://datasetsearch.research.google.com
It shows the unempoyment rate in MA at various diffrent dates to observe changes
MIT Licensed



Comments
Sign in to join the discussion.