🌍 Public
map-dot-density
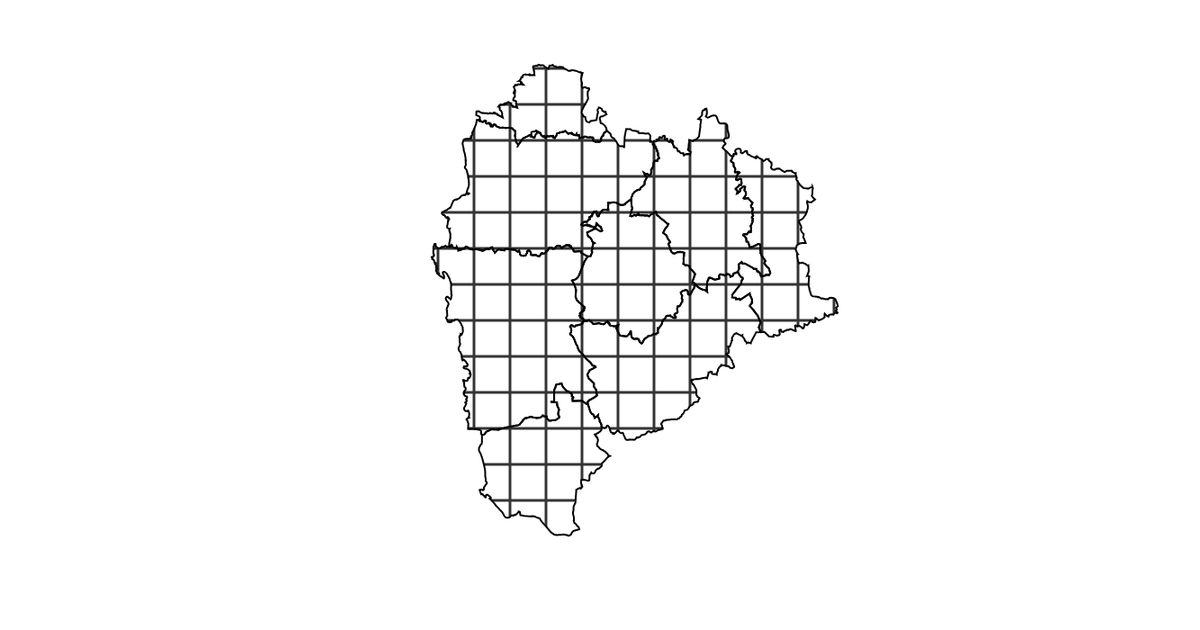
This map shows the percentage of stunted children across eight blocks in Palghar, India, using a choropleth coloration over administrative boundaries. The visualization is implemented with D3 v5, projecting the GeoJSON geometry using `geoMercator` and rendering the polygons with `geoPath`. A slider, from `d3-simple-slider`, adjusts the color scale bins, while textures from the `textures` library are applied to the SVG. Hovering over a block reveals a tooltip with the exact percentage.
AI-generated descriptionMIT Licensed




Comments
Sign in to join the discussion.