🌍 Public
map-line-size
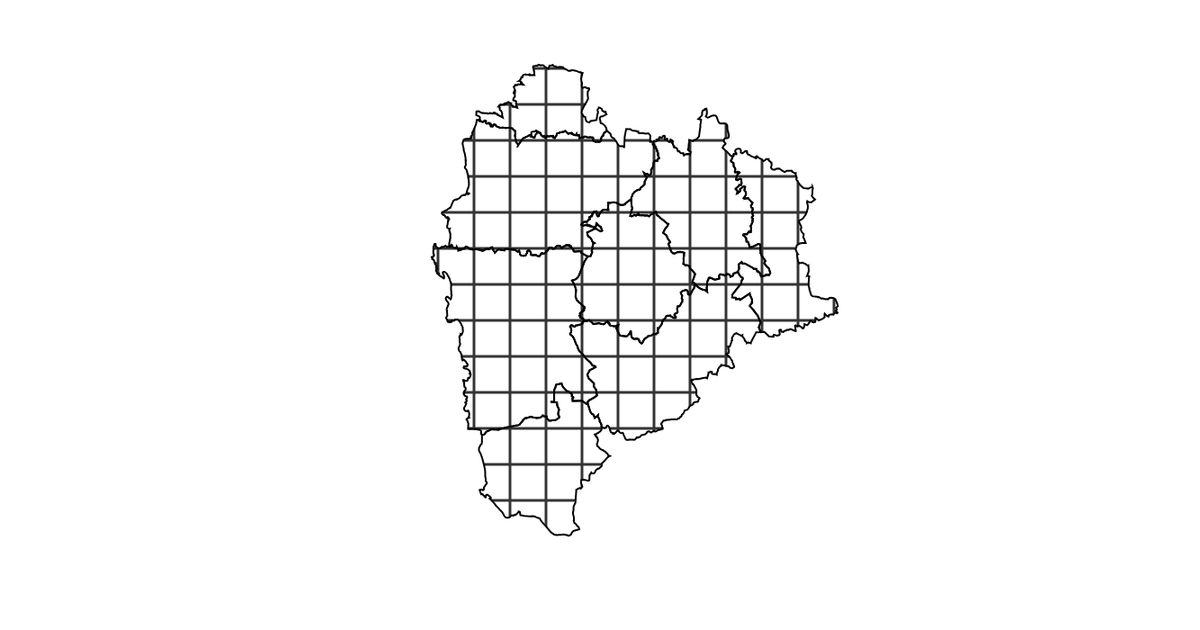
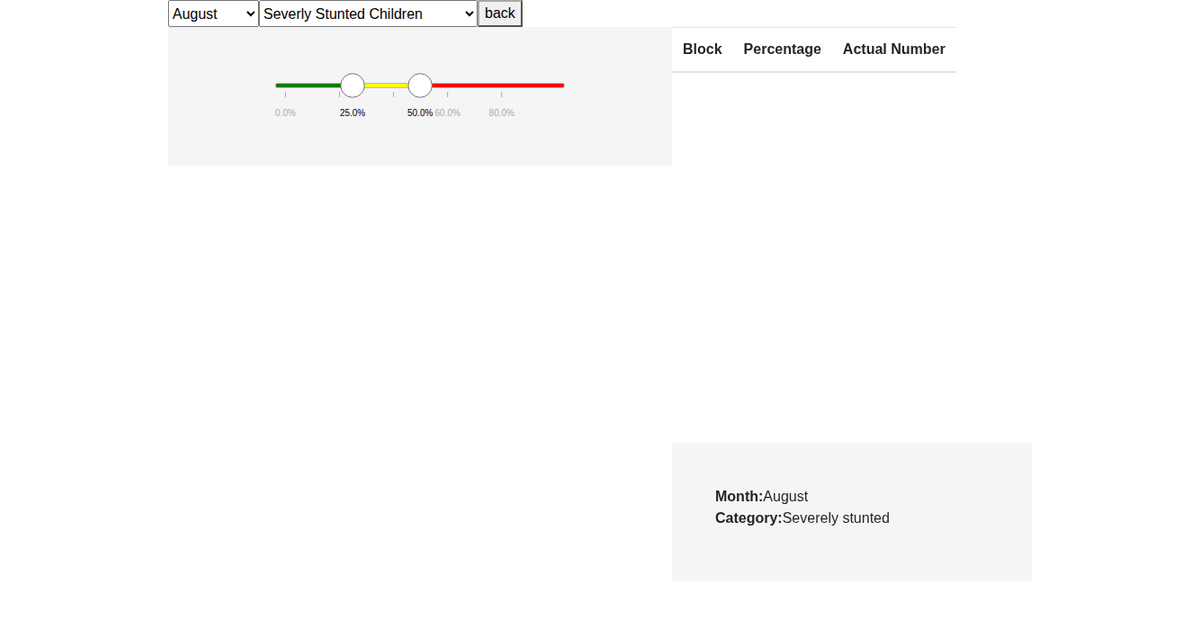
This example visualizes stunted child percentages across administrative blocks in Palghar, India, using a choropleth map. A slider allows users to adjust the classification range, dynamically recoloring regions with textured diagonal lines of varying stroke widths. The map uses d3.geoMercator and d3.geoPath to project GeoJSON boundaries, while d3.csv-joined data drives the fill logic. Interactive features include zooming via d3.zoom, hover tooltips, and smooth transition animations on slider input. The textures library creates the line patterns, and Bootstrap styles the slider interface.
AI-generated descriptionMIT Licensed




Comments
Sign in to join the discussion.