🌍 Public
Area chart week temperatures
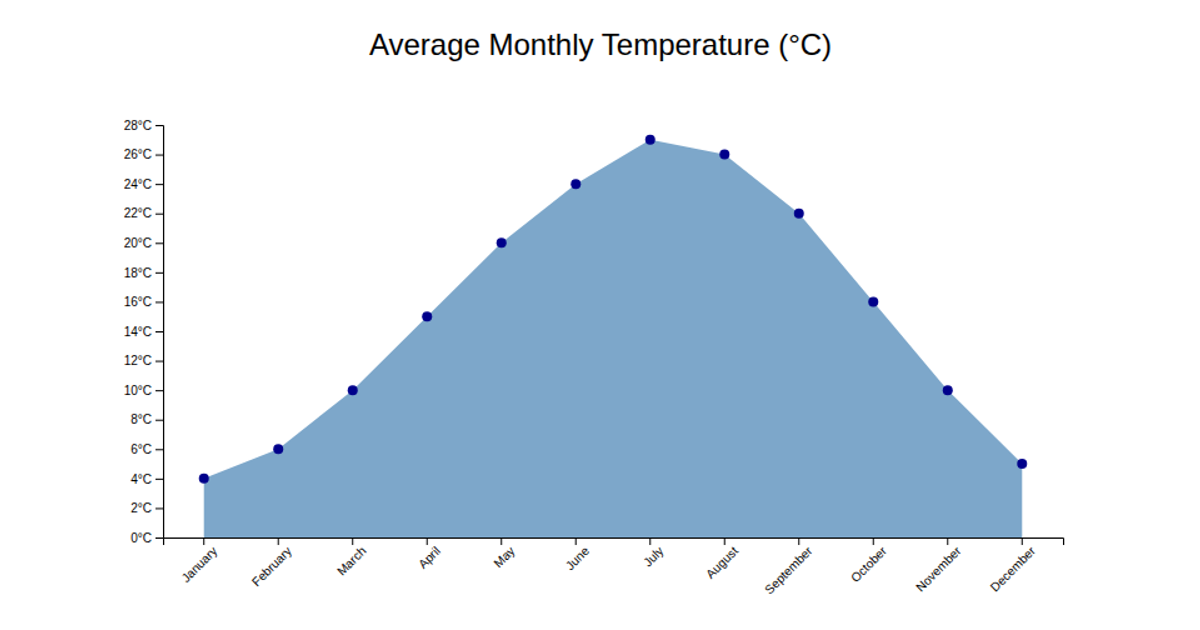
This example visualizes a week of temperature readings in Rio de Janeiro as an area chart. The orange line and semi-transparent area fill show temperature fluctuations over time, with individual data points marked by circles. The chart uses D3.js APIs including `d3.area`, `d3.line`, `d3.scaleTime`, and `d3.scaleLinear` to construct the visualization. Data is loaded from a CSV file containing sensor readings, and the chart is rendered as an SVG with styled axes and gridlines.
AI-generated descriptionMIT Licensed



Comments
Sign in to join the discussion.