🌍 Public
Untitled
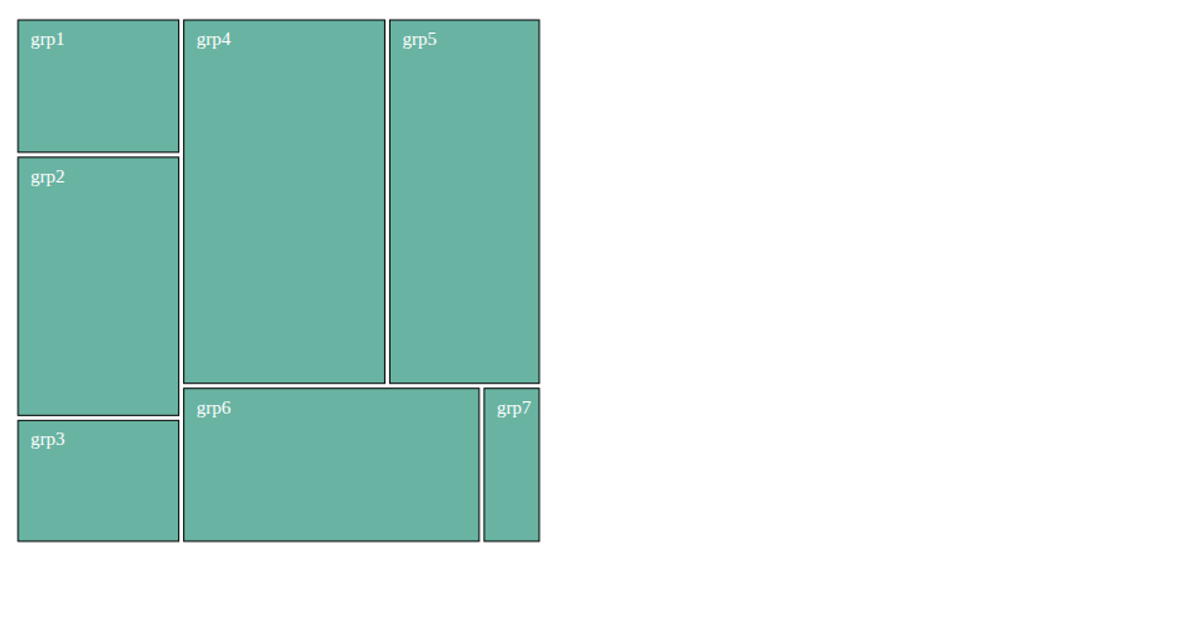
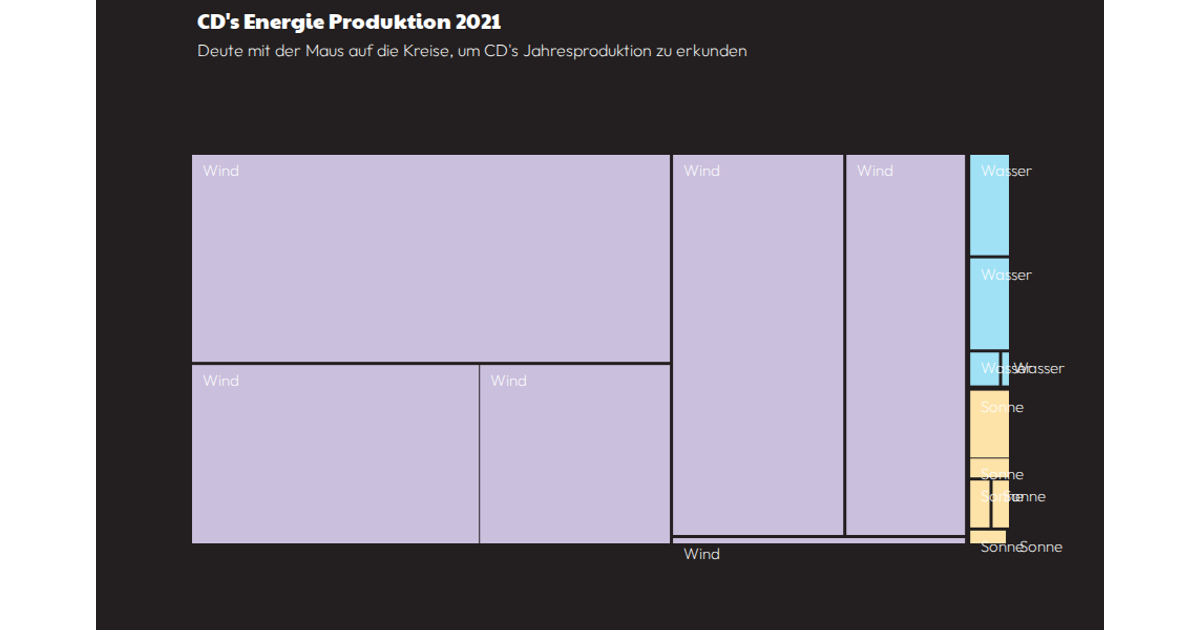
A treemap visualizes the distribution of Czech energy sources, with rectangles sized by value and labeled with names like uhlí, nafta, and plyn. The code uses D3 v4’s `d3.stratify` to build a hierarchy from CSV data and `d3.treemap` to compute layout positions. SVG rectangles and text labels are appended to the chart, with fills styled via a linked stylesheet.
AI-generated descriptionAlt+96 = `<br> Alt+ů = $<br> Základní bar chart je hotový do 3:42:42
MIT Licensed



Comments
Sign in to join the discussion.