🌍 Public
Reusable Treemap
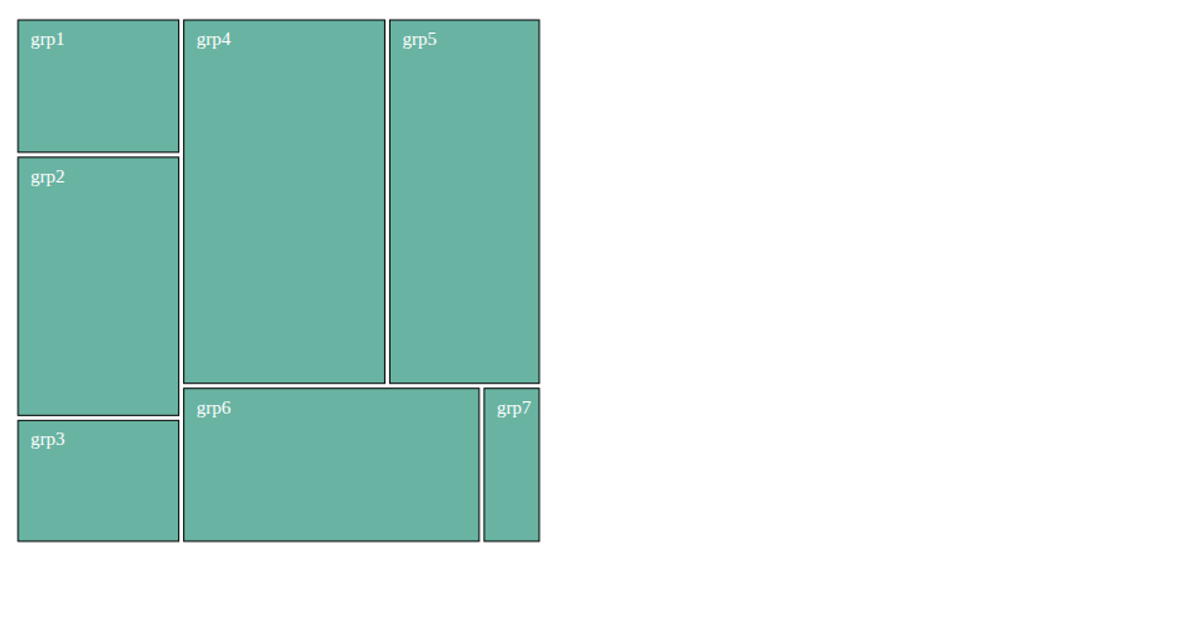
This visualization displays the annual energy production of Courant d'Air for 2021, broken down by energy source (wind, solar, water), municipality, and enterprise. Users hover over rectangular cells to explore the hierarchical data through tooltips with production values in MWh. The treemap uses D3's `treemap` layout, `hierarchy`, and `scaleOrdinal` functions to compute and color the nested rectangles, with SVG rectangles and text labels rendered on canvas. Interactivity includes hover effects that adjust rectangle stroke and fill, plus tooltip transitions.
AI-generated descriptionMIT Licensed




Comments
Sign in to join the discussion.