🌍 Public
Style Refactored Transplant Bar
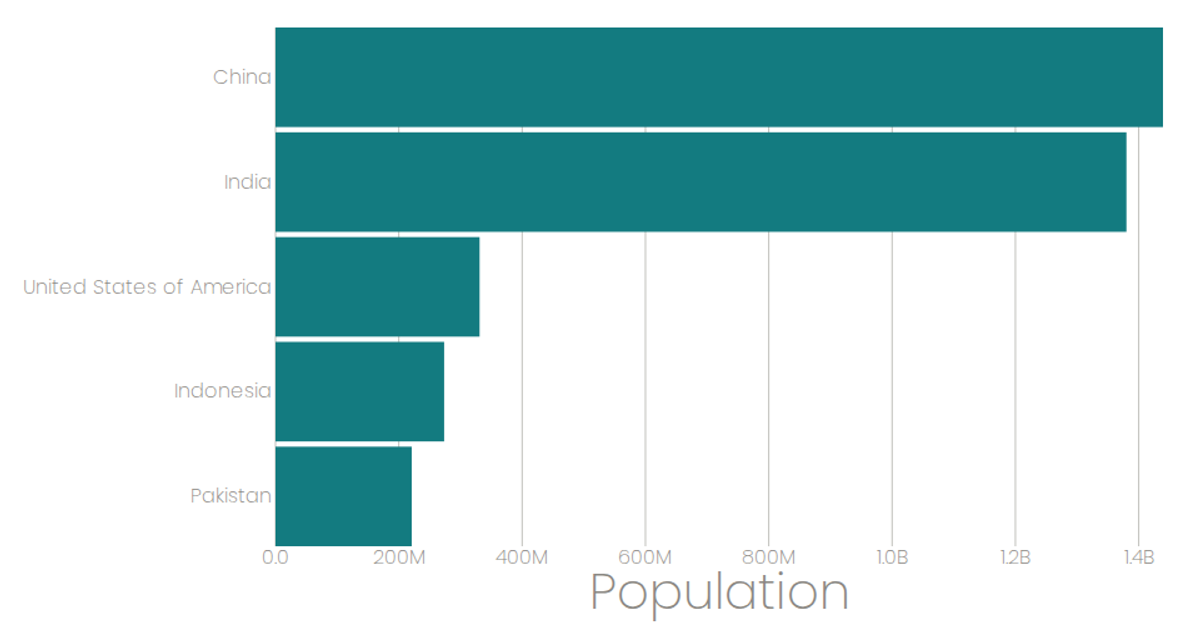
This bar chart displays kidney transplant totals by hospital, using horizontal bars to compare values across institutions. The visualization is built with React and D3 v6, leveraging `scaleBand` and `scaleLinear` for axes, while data is loaded from a CSV via `useData` hook. The chart filters to hospitals with at least 250 total transplants, with bars colored teal and including hover tooltips. SVG rendering handles marks and axis ticks, with styled gridlines and labels for readability.
AI-generated description##Transplant Data
MIT Licensed


Comments
Sign in to join the discussion.