🌍 Public
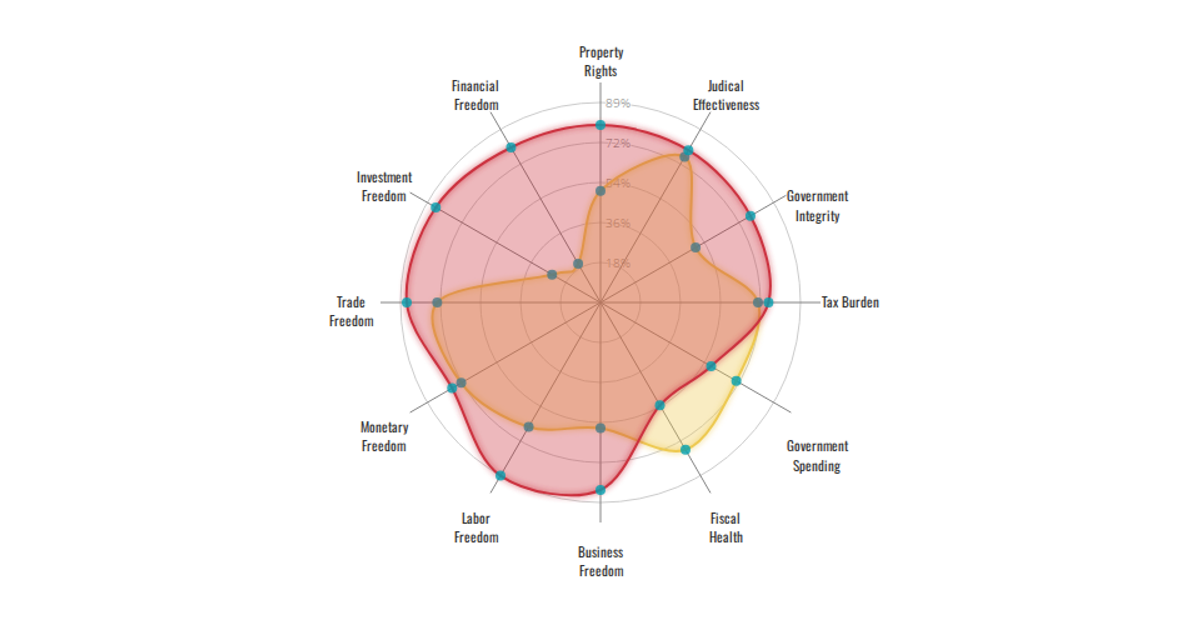
[Version3]Economic Freedom Index Radar Chart-China vs US
Hhotdoujiang
Last edited Oct 27, 2019
Created on Oct 2, 2019
This interactive radar chart compares Economic Freedom Index scores for China and the United States across twelve indicators. A dropdown menu lets users switch between the two countries, revealing the respective data as a colored polygon. The visualization is built with React and D3.js, adapting Nadieh Bremer’s radar chart design. It uses `d3.scaleOrdinal` for color and a custom `RadarChart` function to render circular axes, levels, and area blobs. The data is embedded directly in the code, with values normalized to a 0–100 scale.
AI-generated descriptionThis is a gorgeous radar chart designed by Nadieh Bremer. So far I am doing well on integrating it with my World Economic Freedom Index dataset.
Here are the modifications based on last version
- Add the menu
MIT Licensed



Comments
Sign in to join the discussion.