🌍 Public
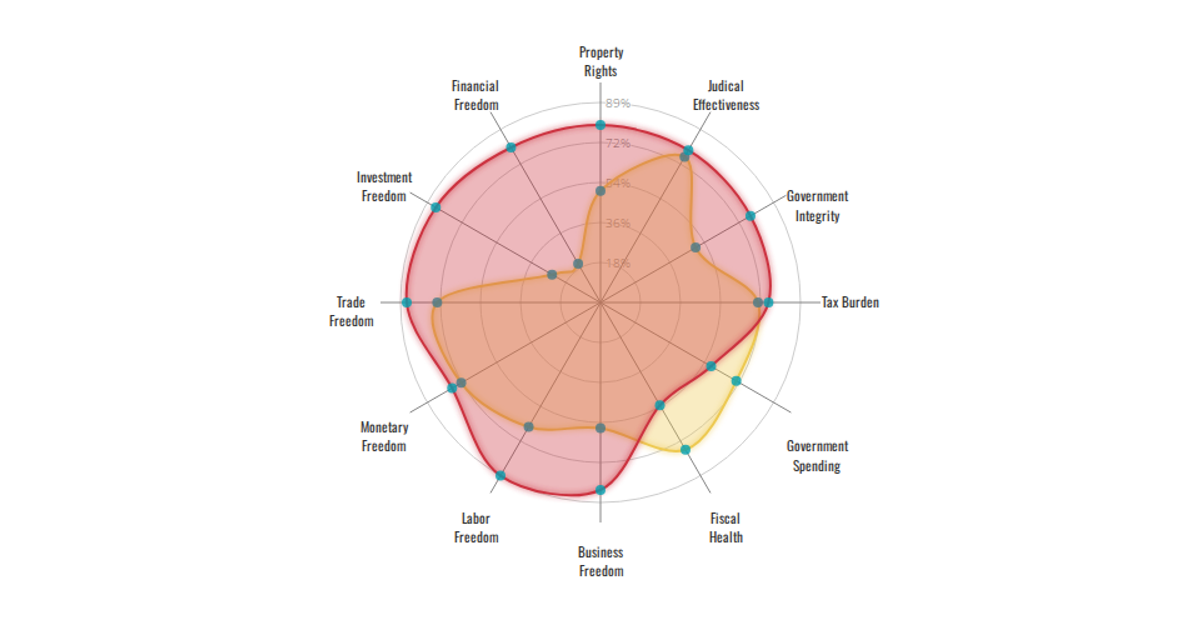
[Version2]Economic Freedom Index Radar Chart-China vs US
Rrwata97
Last edited Apr 23, 2023
Created on Apr 20, 2023
This radar chart compares China's economic freedom scores across twelve metrics, including property rights, tax burden, and financial freedom. It uses the D3.js framework, specifically leveraging a custom `RadarChart` function that draws SVG paths with animated, rounded strokes. The data is loaded directly from the Index.js file, not external sources, and the chart is styled with CSS using Google Fonts. The visualization is based on a design by Nadieh Bremer, adapted for this specific economic dataset.
AI-generated descriptionThis is a gorgeous radar chart designed by Nadieh Bremer. So far I am doing well on integrating it with my World Economic Freedom Index dataset.
Here are the modifications based on last version
- Change the data loading method
MIT Licensed



Comments
Sign in to join the discussion.