🌍 Public
Fork of Fork of React & D3 Starter
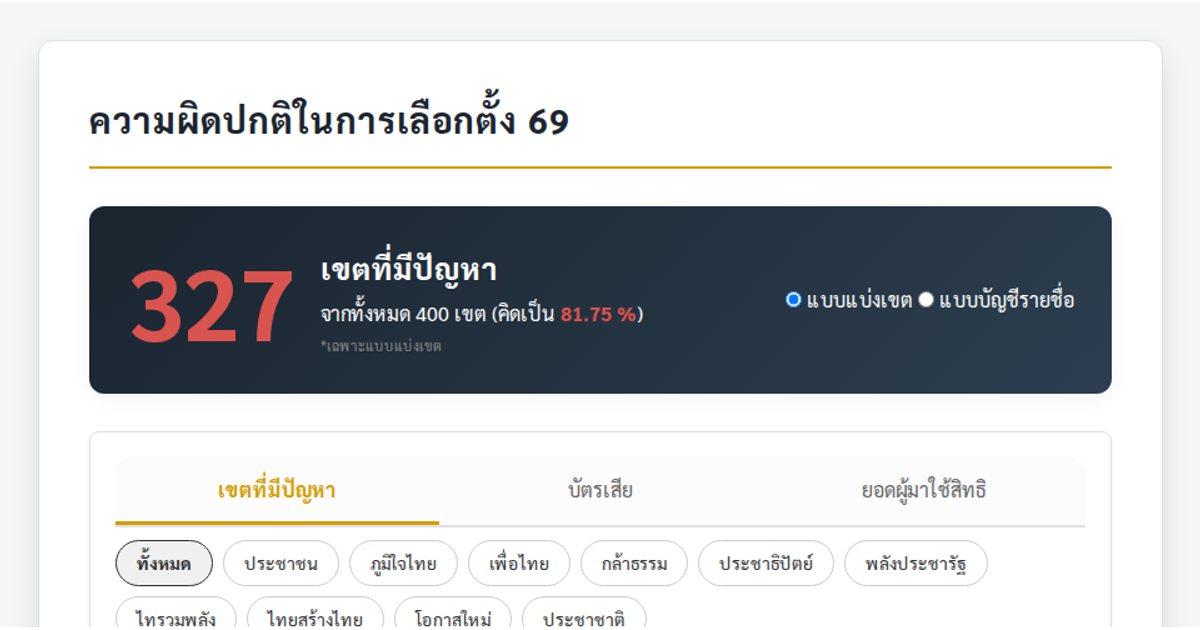
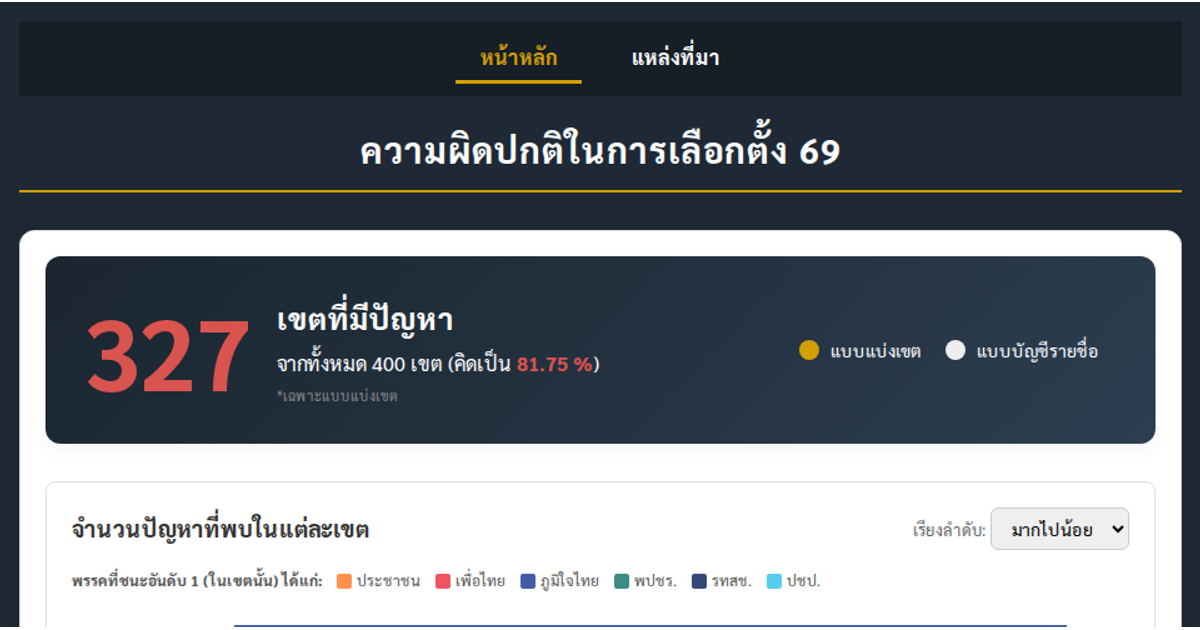
This dashboard visualizes election irregularities across Thailand’s 400 districts, comparing constituency and party-list results. Users toggle between election types and view modes (problem areas, invalid ballots, voter turnout) to update synchronized bar charts, pie charts, scatterplots, and a grid-based map. The D3 v7 code uses `d3.csv` to load data, `d3.rollup` for aggregation, `d3.scaleOrdinal` for party colors, and `d3.arc` for pie segments, with animated transitions and interactive tooltips.
AI-generated descriptionMIT Licensed




Comments
Sign in to join the discussion.