🌍 Public
Fork of Fork of React & D3 Starter
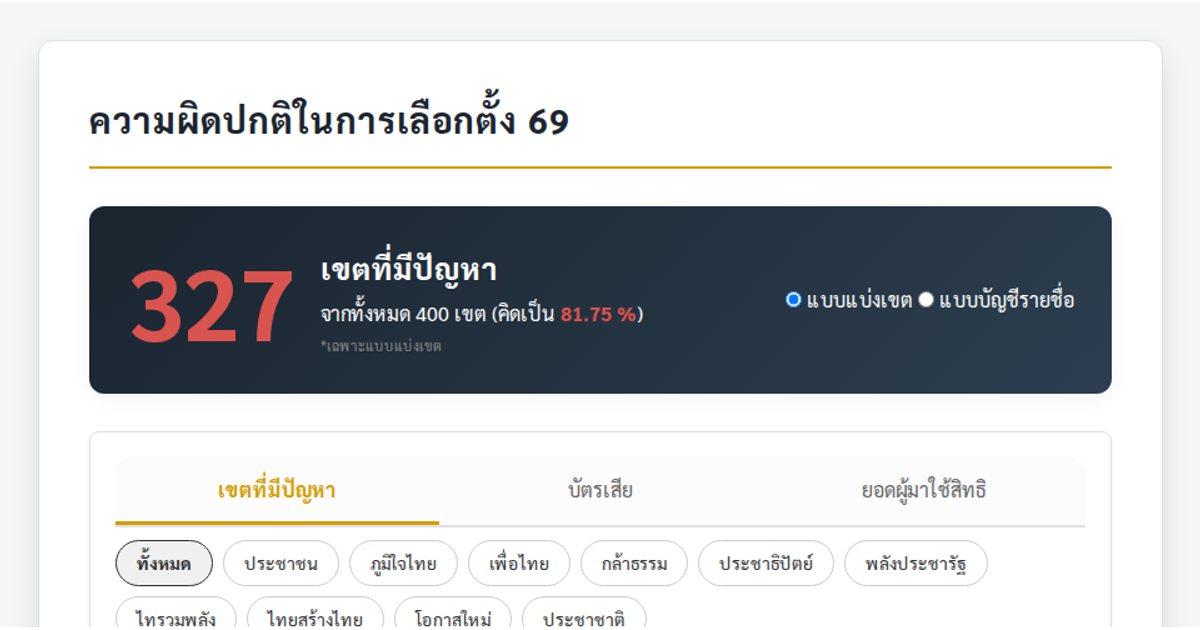
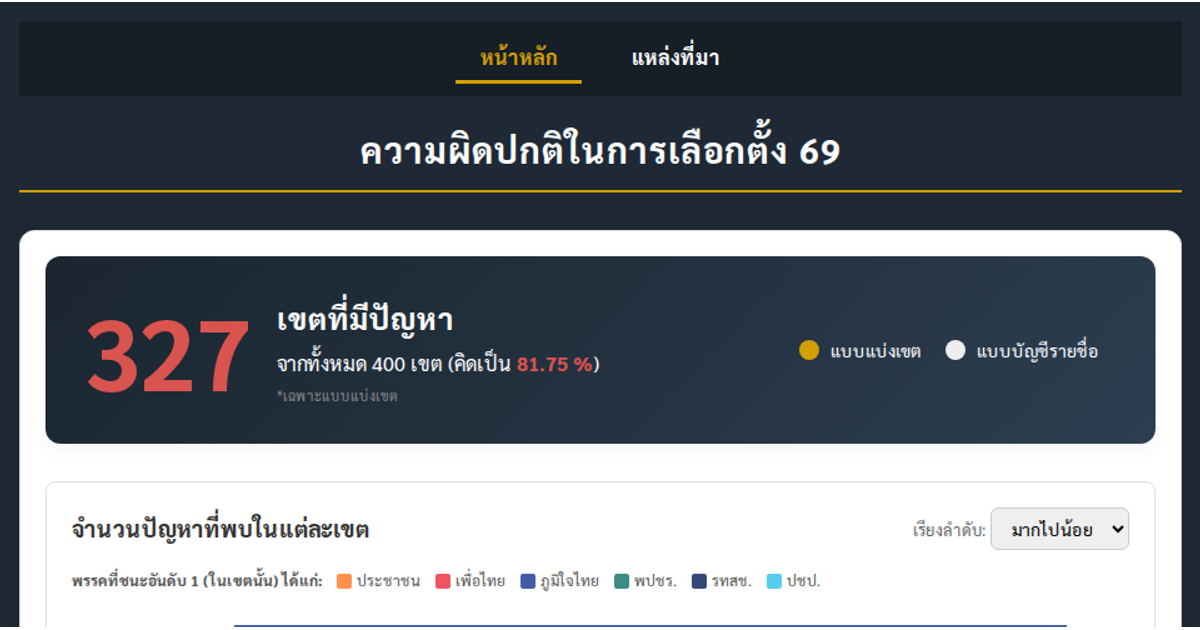
This dashboard visualizes election irregularities across 400 Thai constituencies, showing problem reports, invalid ballots, and voter turnout. Users switch between district and party-list results and filter by winning party. D3.js v7 powers the interactive choropleth map built with `d3.geoPath`, animated bar charts, pie charts, and a scatterplot charting margin of victory against reported anomalies, all reading from a CSV file.
AI-generated descriptionMIT Licensed




Comments
Sign in to join the discussion.