🌍 Public
barchart andersom
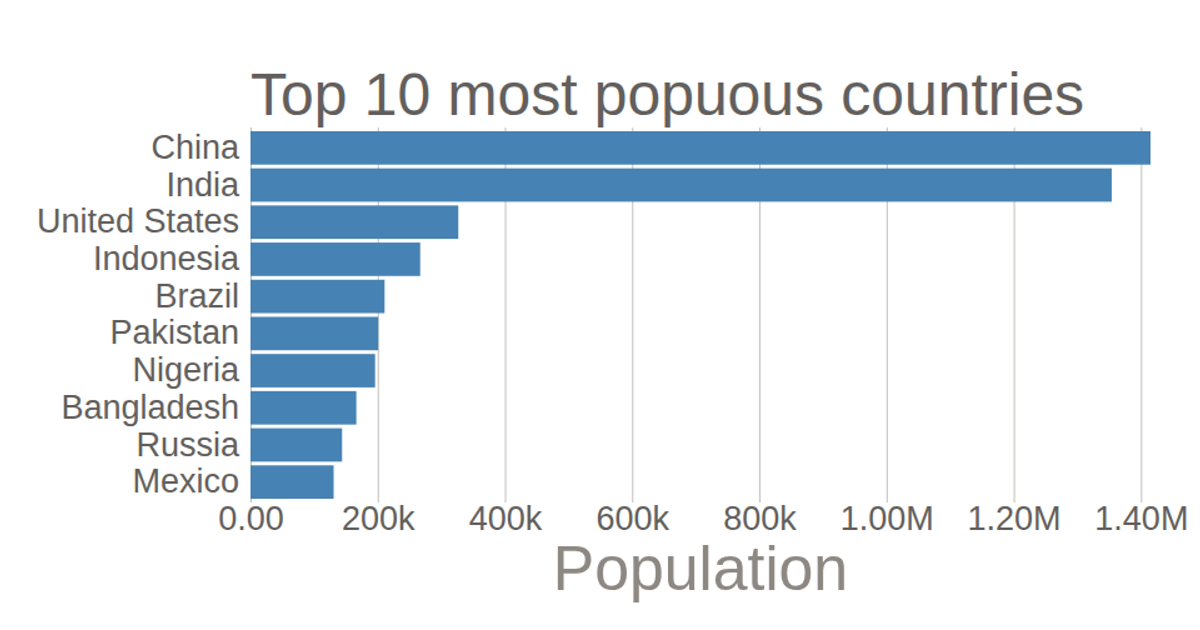
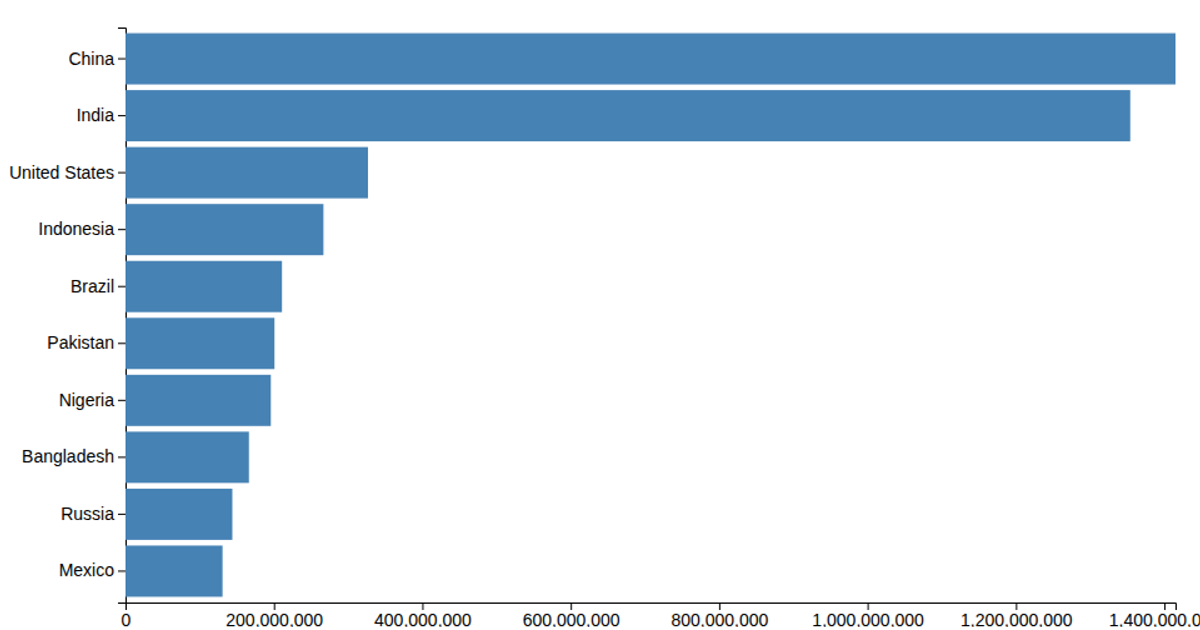
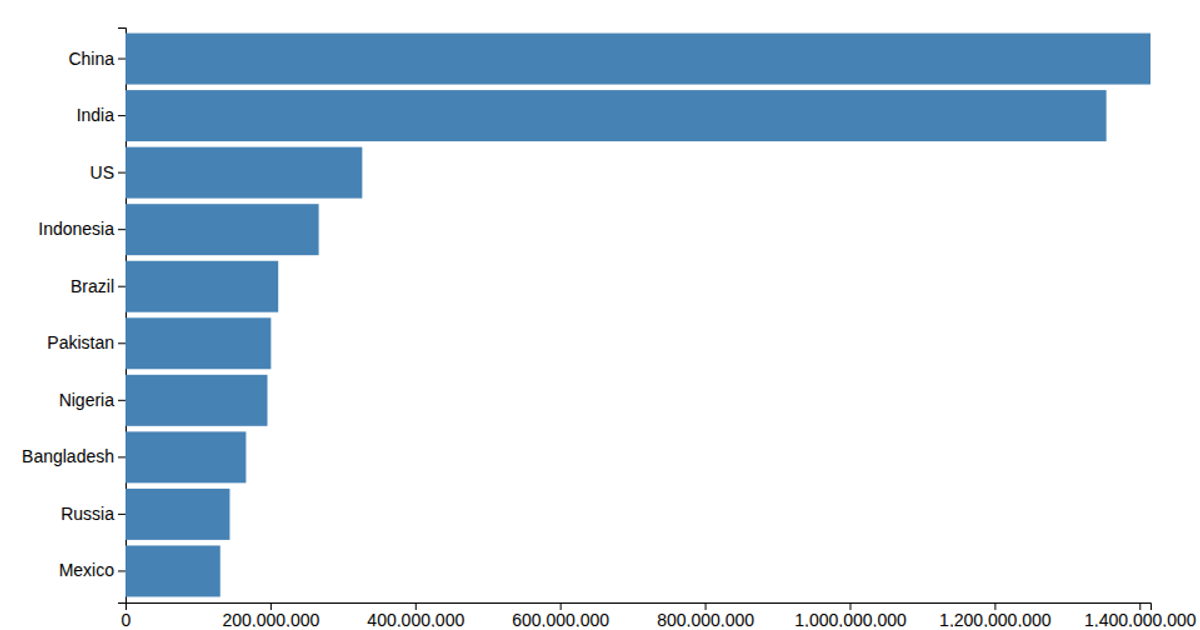
This bar chart displays population figures for ten countries, with the y-axis inverted so the highest values appear at the bottom and lower values rise upward. The chart uses a linear scale for population, a band scale for country names, and renders bars as SVG rectangles. D3 v5’s `csv` function loads the data, while `axisLeft` and `axisBottom` add the axes.
AI-generated descriptionMIT Licensed



Comments
Sign in to join the discussion.