0 views in last 90 days
Nathan Neelis
@NathanNeelis
Student @ Communication MultiMedia Design At University of applied siences
Public vizzes
CBS Dataviz nL

grouped barchart test 2

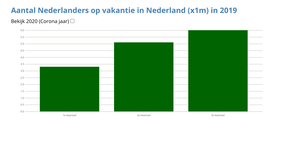
Vacation in corona

Testing grouped barchart
Interactive barChart TRYING NEW TRANSITIONS
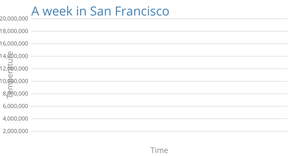
Temperature in San Fransisco Line Chart

Temperature in San Fransisco Line Chart
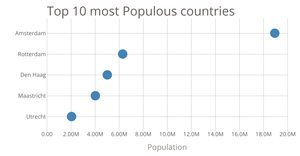
Scatter plot

Interactive barChart (v12.11.20:00)

Interactive barChart (v11.11_10:00)
Interactive barChart (v11.11.13:30)
barchart andersom

Bowl of fruit - general update pattern
Interactive barChart (v11.11.12:00)

Interactive barChart (v11.11_11:10)
Interactive barChart (v10.11_19:00)
clean code with modules (v10.11_17:00)
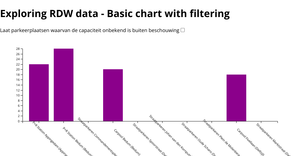
Exploring RDW data - Basic chart with filtering
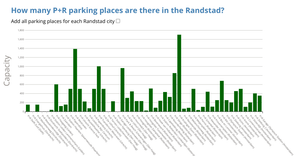
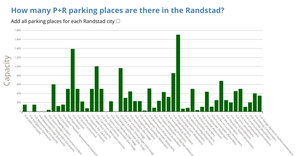
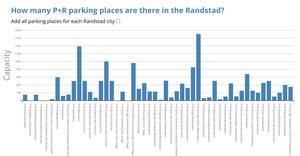
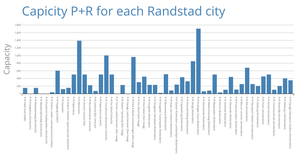
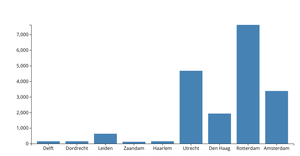
Randstad city vs Capacity - styling
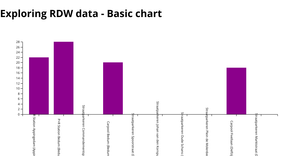
Exploring RDW data - Basic chart
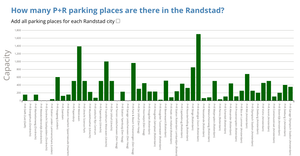
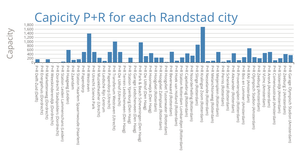
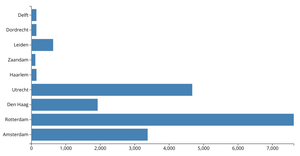
Randstad city vs Capacity
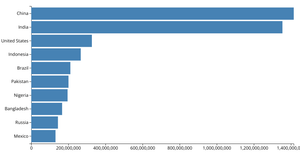
Making a Bar Chart - NPR data

Scatter plot - npr data

testing nathan
Bind data to html with d3
Making a Bar Chart
Tweaking the Bar Chart
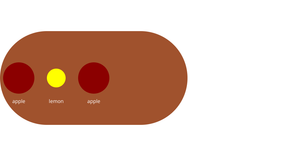
Bowl of fruit - general update pattern (v2)

World population area chart

Temperature in San Fransisco area Chart

Temperature in San Fransisco

Cars Scatter plot