🌍 Public
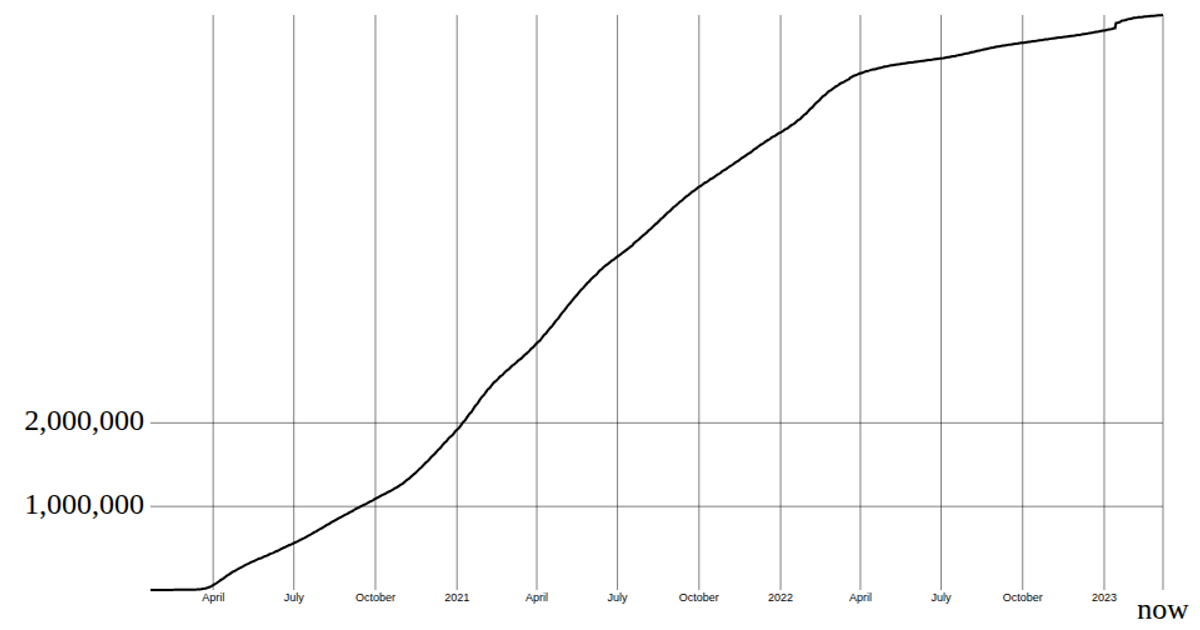
coronavirus line chart
This visualization displays the total number of coronavirus deaths worldwide as a single numeric readout, updated to the dataset’s most recent date column. It uses React with a custom `useData` hook that loads the Johns Hopkins CSSE time-series CSV via `d3.csv`, then sums the last column’s values across all countries. The total is formatted with `d3.format` (the `format(",")` comma formatter) and rendered inside a React component. While called a “line chart,” the code only presents the cumulative death toll as a message, not an actual line graph.
AI-generated descriptionReact Starter code.
MIT Licensed






Comments
Sign in to join the discussion.