🌍 Public
coronavirus data summary
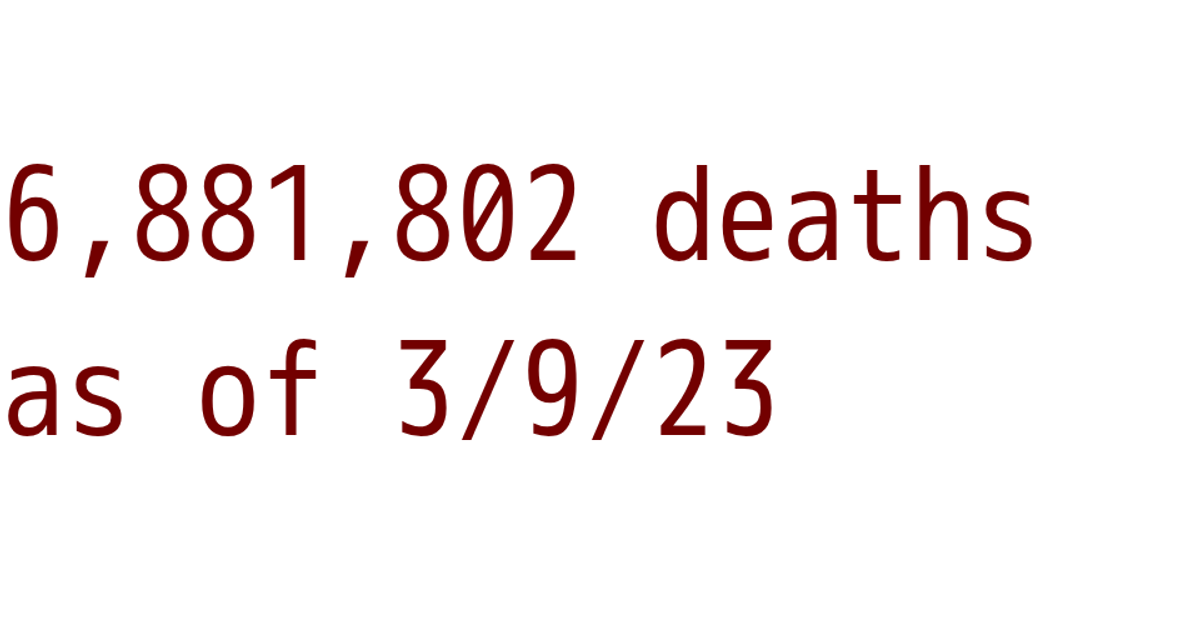
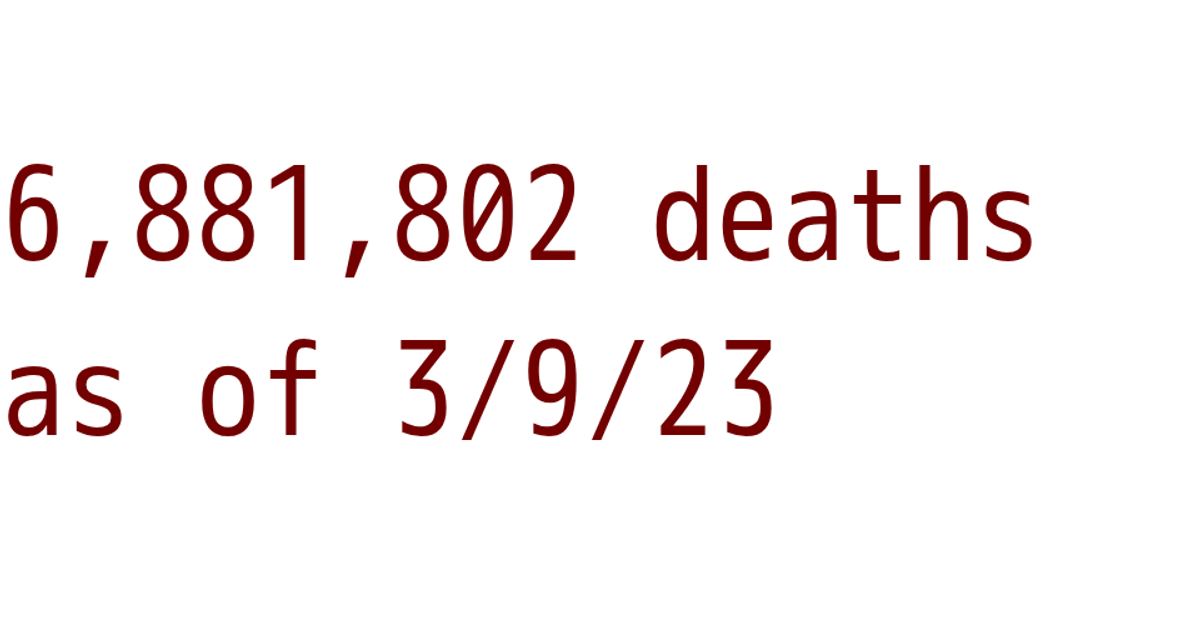
This example displays a single summary statistic: the total number of COVID-19 deaths worldwide since the most recent date in the time-series dataset. A React component fetches the global death-count CSV from the CSSEGISandData GitHub repository using d3.csv, then extracts the last column’s values and sums them with a reduce operation. The final number is formatted with d3.format(",") and rendered as text within a div, updating automatically once the asynchronous data load completes.
AI-generated descriptionReact Starter code.
MIT Licensed




Comments
Sign in to join the discussion.