🌍 Public
Fork of Bubble chart
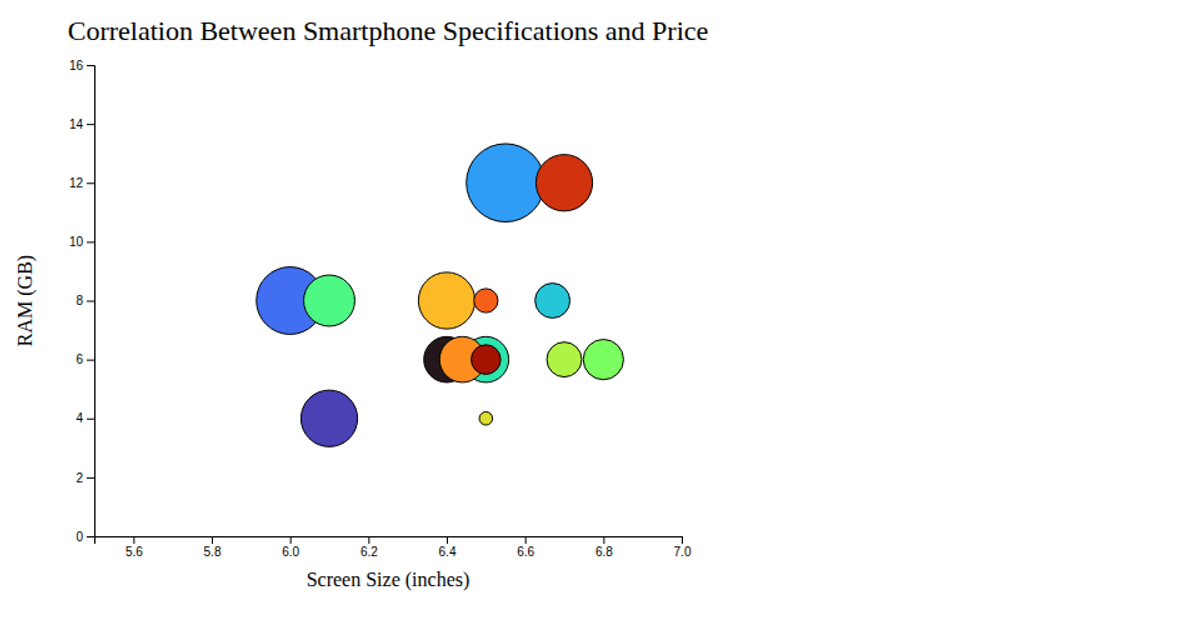
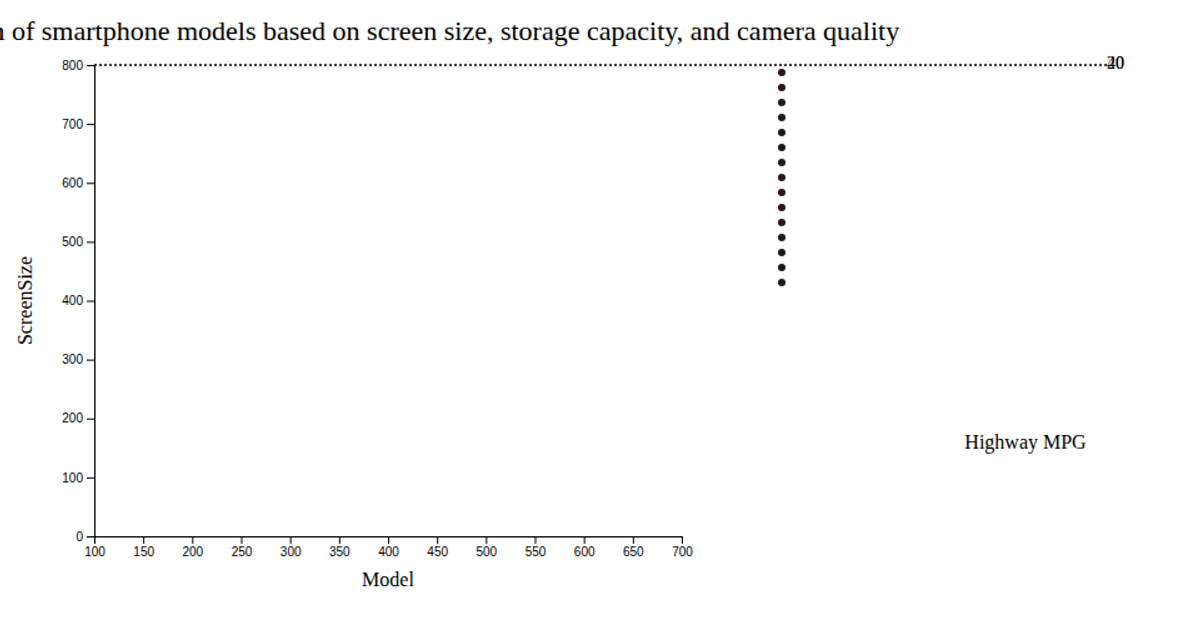
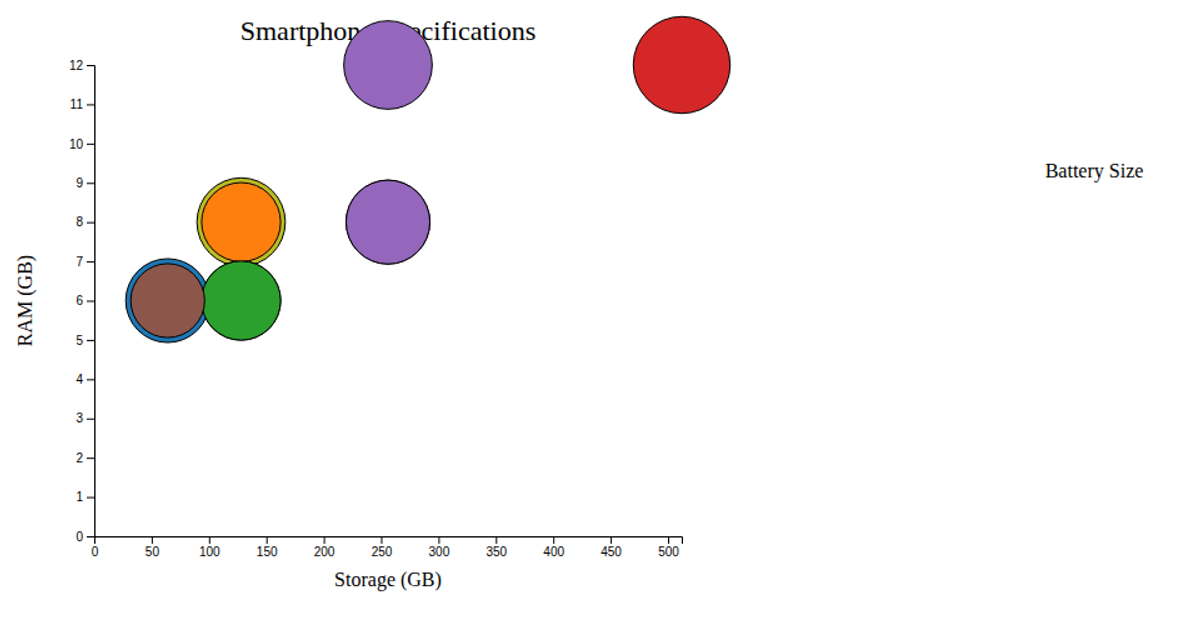
A bubble chart displays smartphone brands by sales, average rating, and available models. Each bubble's x-position represents rating, y-position represents sales, and size represents model count. The chart uses SVG circles with D3.js v7 scales: `d3.scaleLinear` for axes and `d3.scaleSqrt` for radii. Labels show brand names, with data embedded directly in the JavaScript source.
AI-generated descriptionMIT Licensed




Comments
Sign in to join the discussion.