🌍 Public
Fork of Bubble chart
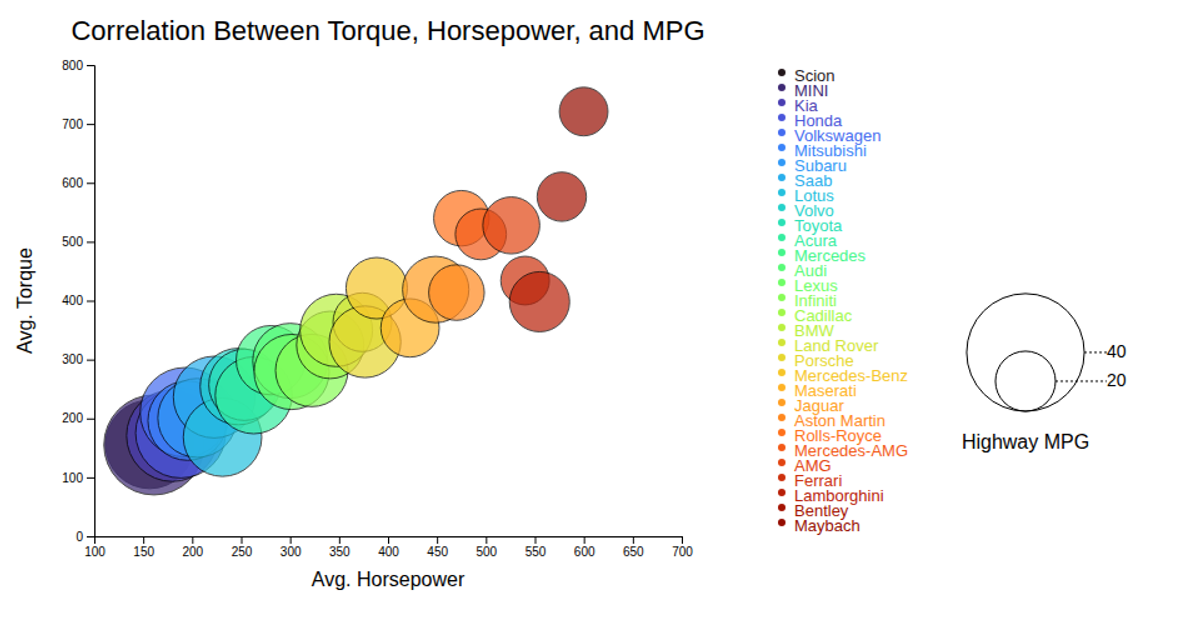
This bubble chart visualizes the correlation between price, battery capacity, and average rating for various car models. Each circle’s x-position shows price, y-position shows battery capacity in mAh, and its radius encodes the average rating. D3’s `scaleLinear` and `scaleOrdinal` map data to positions, sizes, and colors, while a custom tooltip displays model details on mouse events. The legend with star values clarifies the rating scale, rendered as SVG with a black stroke.
AI-generated descriptionMIT Licensed




Comments
Sign in to join the discussion.