🌍 Public
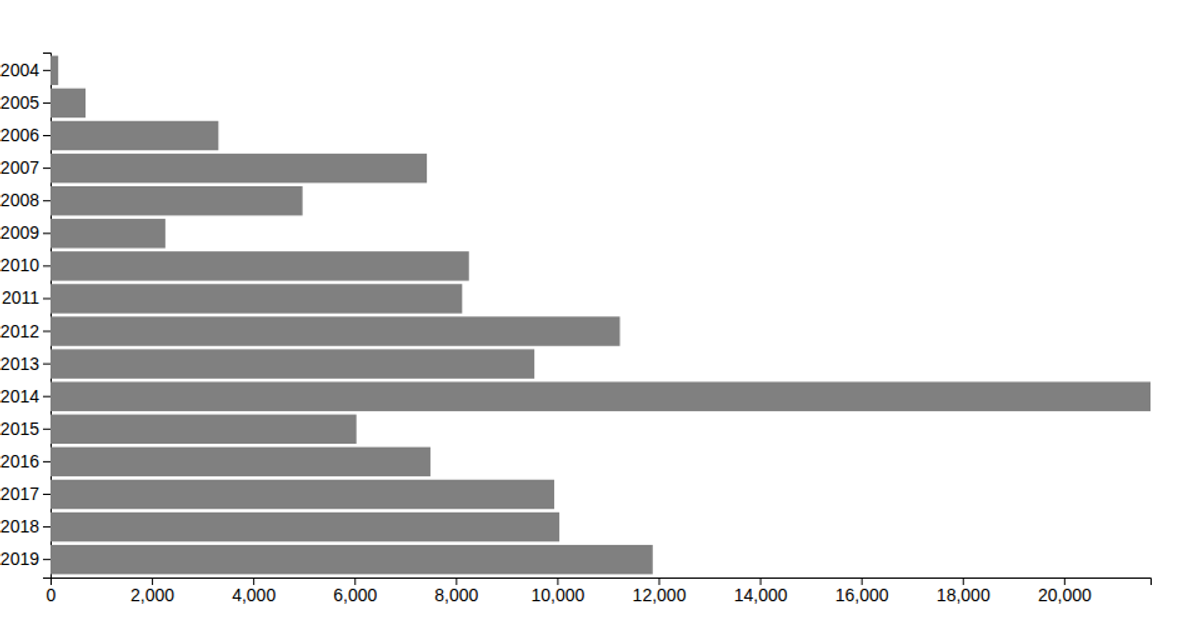
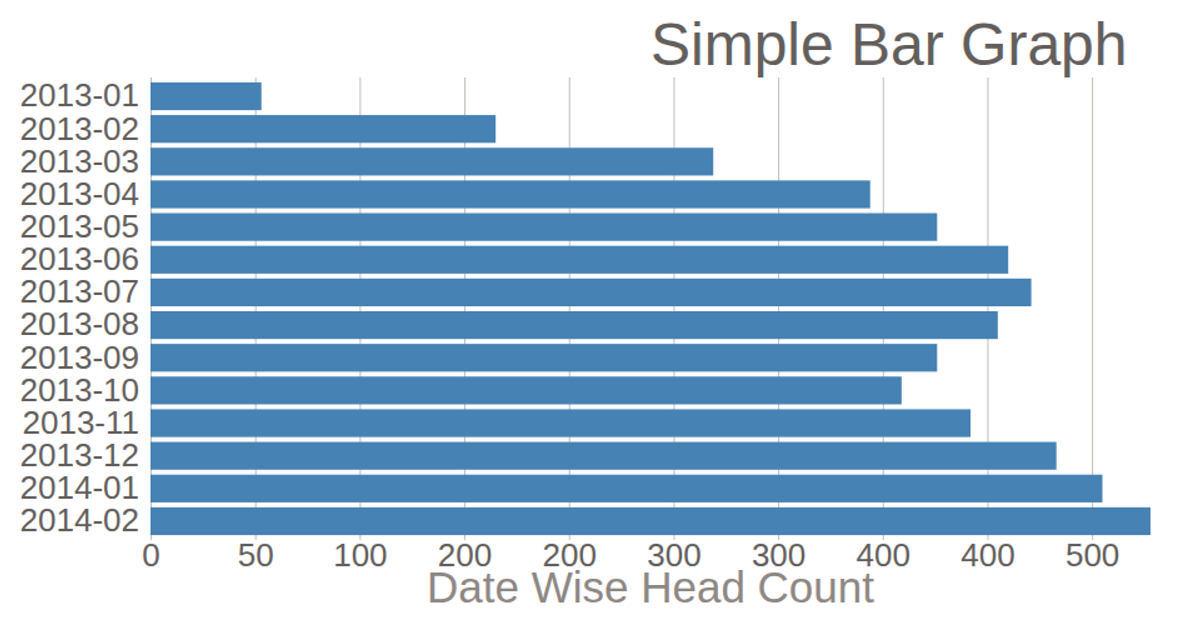
User Anmeldungen nach Datum
This visualization displays the number of fictional user registrations per date as a horizontal bar chart, with dates on the y-axis and counts on the x-axis. The SVG rendering is built with d3.v5, using `scaleLinear` for the continuous count axis, `scaleBand` for the categorical date axis, and `axisLeft` and `axisBottom` for the chart's ticks. The data comes from an external `data.csv` file, parsed with d3's `csv` function, and includes a title and light green bars with black strokes.
AI-generated descriptionTest for displaying the amount of user registrations by date.
The data used is compoletely finctional.
MIT Licensed




Comments
Sign in to join the discussion.