🌍 Public
Stylized Attendance
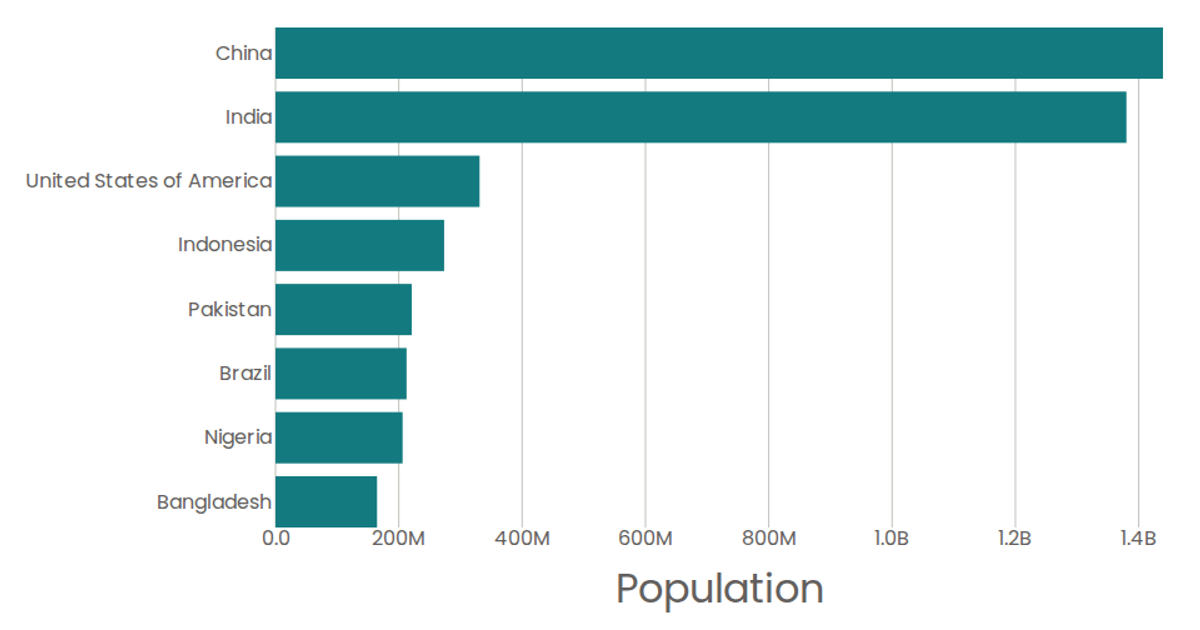
This bar chart displays attendance counts by year. The graph uses a linear scale for the attendance values and a band scale for the years, with the bars extending from the left axis. Built with React and D3 v5, the visualization renders as SVG, pulling data from a CSV file via the `d3.csv` function. The chart includes custom axes (`AxisBottom`, `AxisLeft`) and rectangular marks (`Marks`) to represent each data point.
AI-generated descriptionSmiley face implementation with React & D3.
MIT Licensed




Comments
Sign in to join the discussion.