🌍 Public
Refactored Attendance
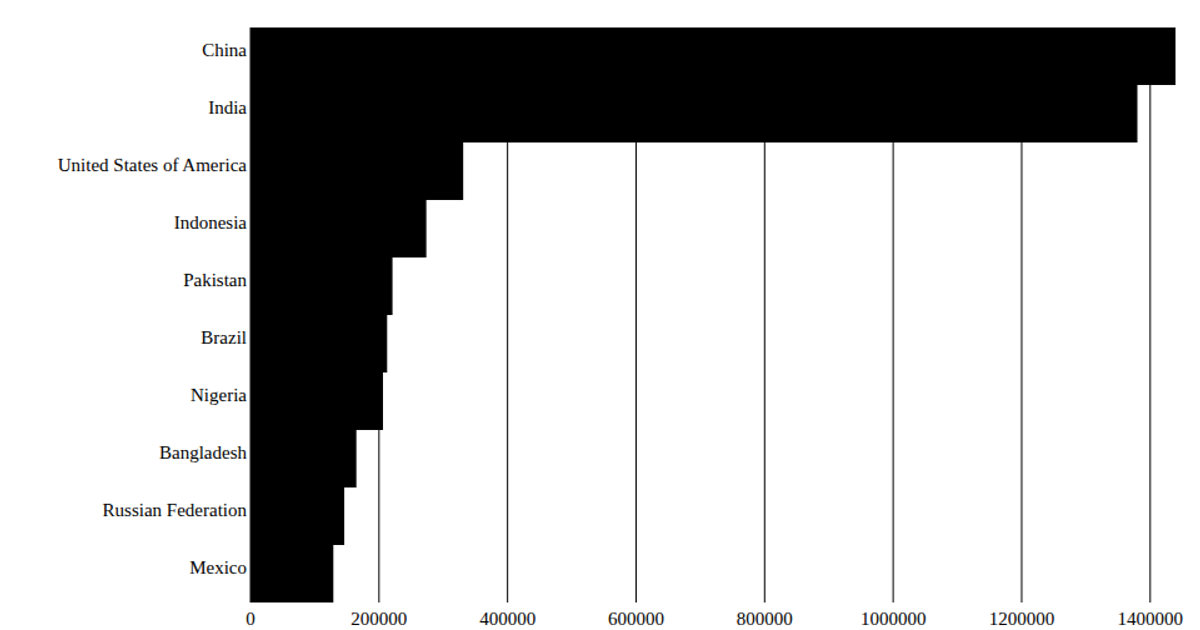
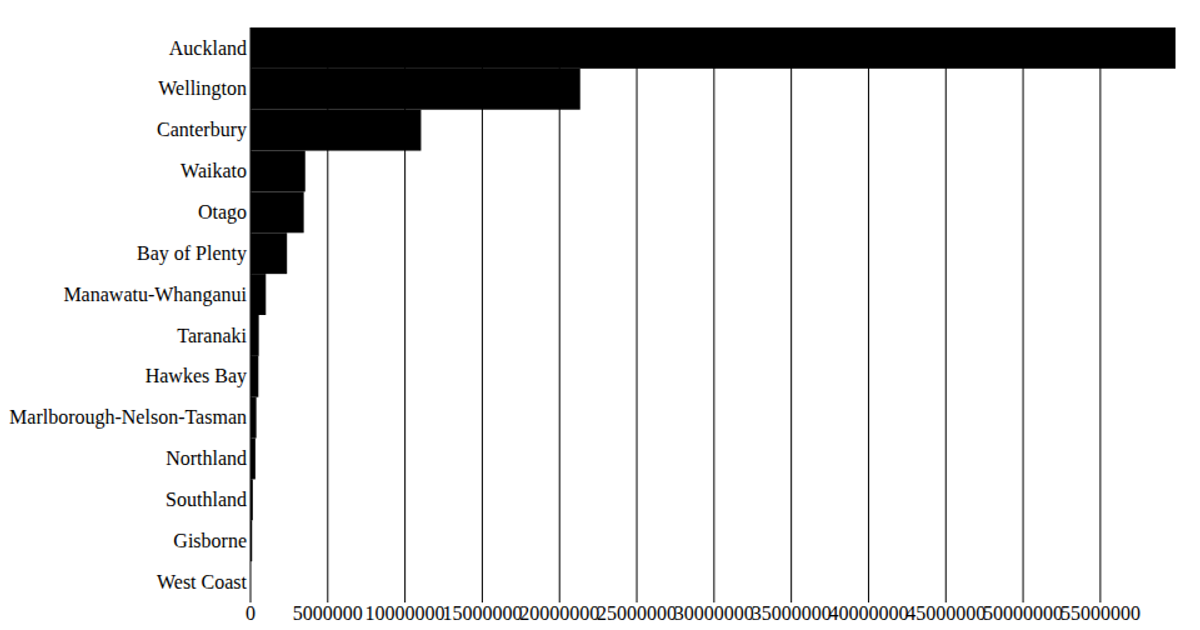
This example displays attendance counts by year as a horizontal bar chart. The bars, rendered as SVG rectangles, encode attendance values on a linear scale while the y-axis uses a categorical band scale for each year. Built with React and D3 v5, the code separates chart components into modular files, uses `scaleLinear` and `scaleBand` for scales, and fetches data from a CSV file via `d3.csv`. The visualization demonstrates a refactored approach to organizing D3 code within a React framework.
AI-generated descriptionSmiley face implementation with React & D3.
MIT Licensed



Comments
Sign in to join the discussion.