🌍 Public
Choropleth Map
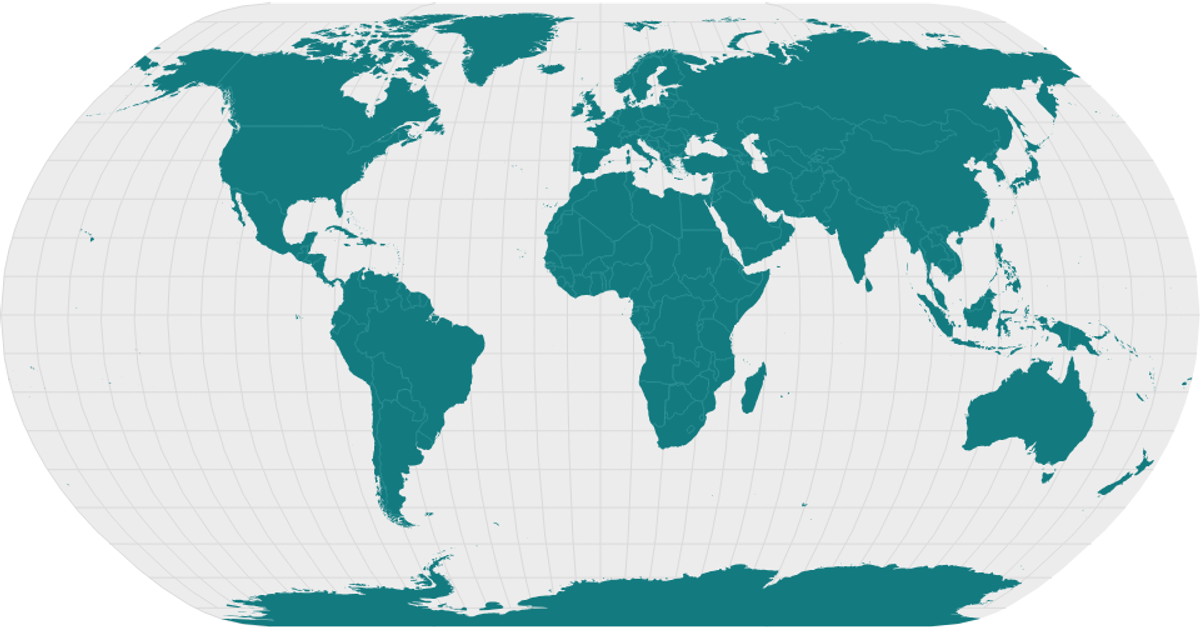
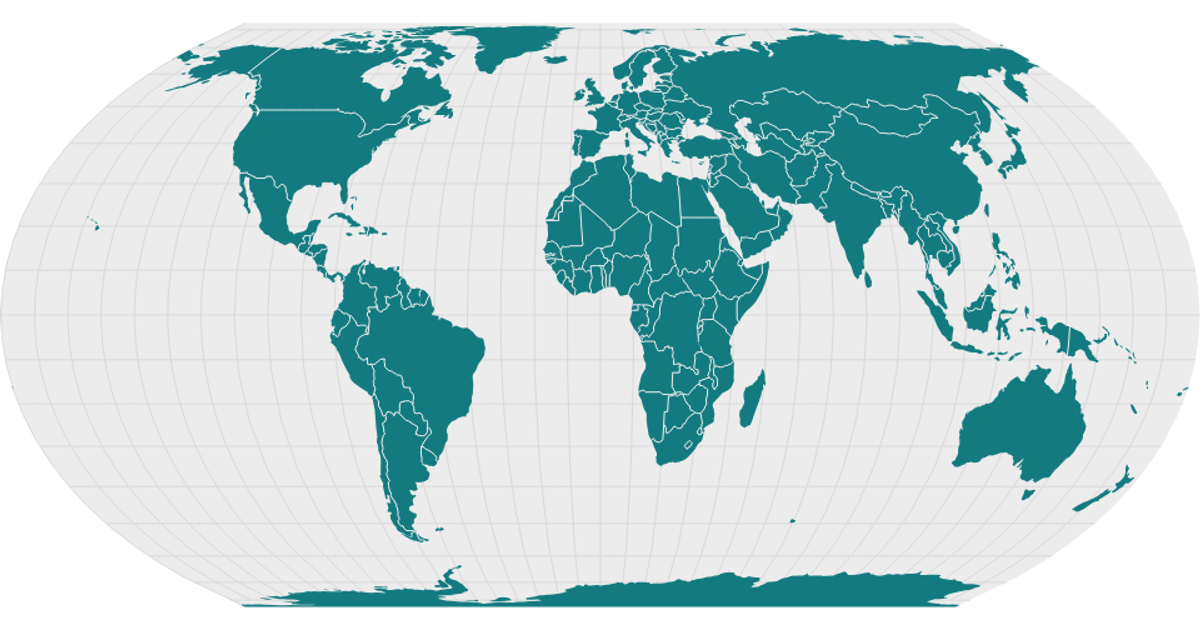
This example shows a world map rendered as a choropleth using geographic boundaries. It displays landmasses with gray graticule lines, a black outline, and white borders between countries. The code loads GeoJSON data converted from TopoJSON using topojson-client, then renders it with d3.geoPath and a d3.geoNaturalEarth1 projection. It uses d3-geo utilities like geoGraticule and React-like state management through a custom viz pattern.
AI-generated descriptionA basic world map.
See also:
MIT Licensed





Comments
Sign in to join the discussion.