🌍 Public
Video Dependency Graph
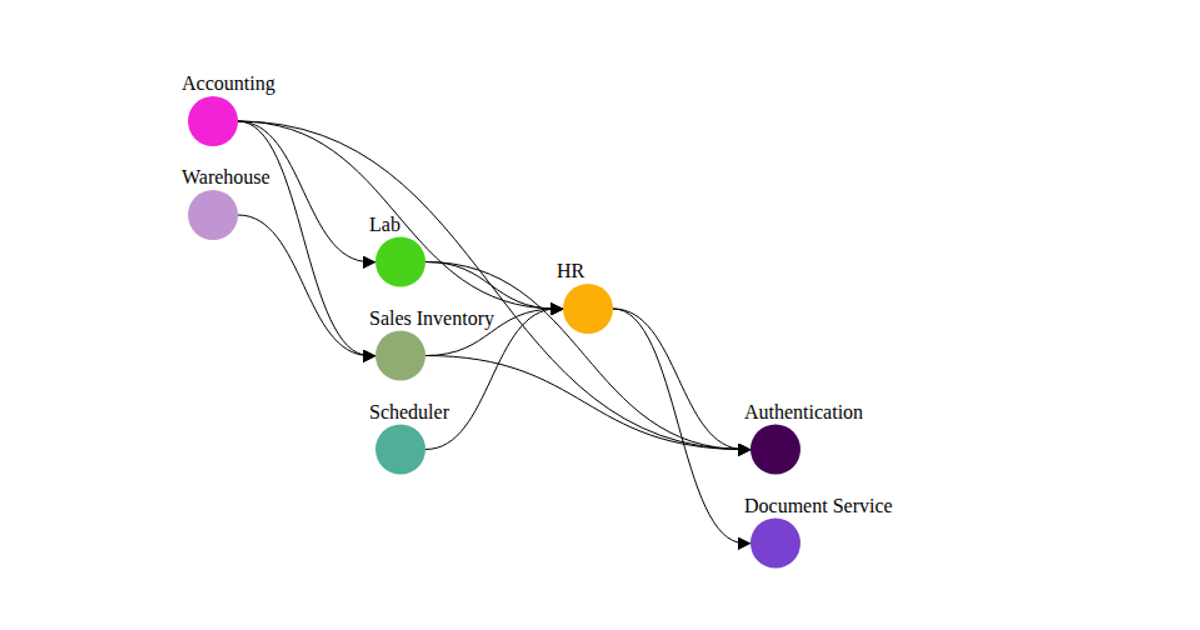
This example displays a dependency graph of video tutorials, mapping nodes that represent individual lessons and the links between them. The visualization uses the D3.js library, version 5, to load the JSON data and render it as a static preformatted text output of the raw structure. The code in `index.js` employs D3’s `json` function to fetch `videos.json` and then uses `select` and `append` to display the data on the page. It does not currently draw a graph, only exposing the JSON content.
AI-generated descriptionMIT Licensed






Comments
Sign in to join the discussion.