🌍 Public
Video Dependency Graph
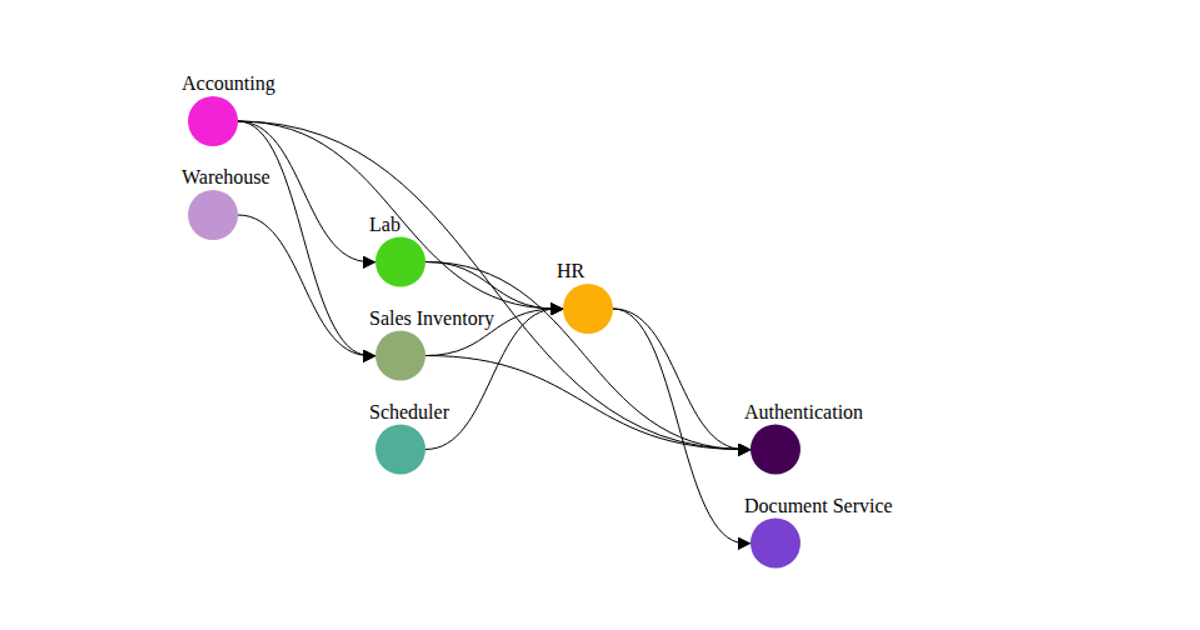
This example displays the dependency structure of a video course as a static graph, listing 14 tutorial nodes with titles and durations, though the link array is initially empty. The visualization loads the JSON dataset and renders it in a `<pre>` element by serializing the data with `JSON.stringify(data, null, 2)`. Using D3 v5's `json()` function and the `select()` API, the code demonstrates a minimal approach to fetching and displaying raw hierarchical data without any interactive or force-directed layout.
AI-generated descriptionMIT Licensed





Comments
Sign in to join the discussion.