🌍 Public
Fork of ICE-7 Line Chart
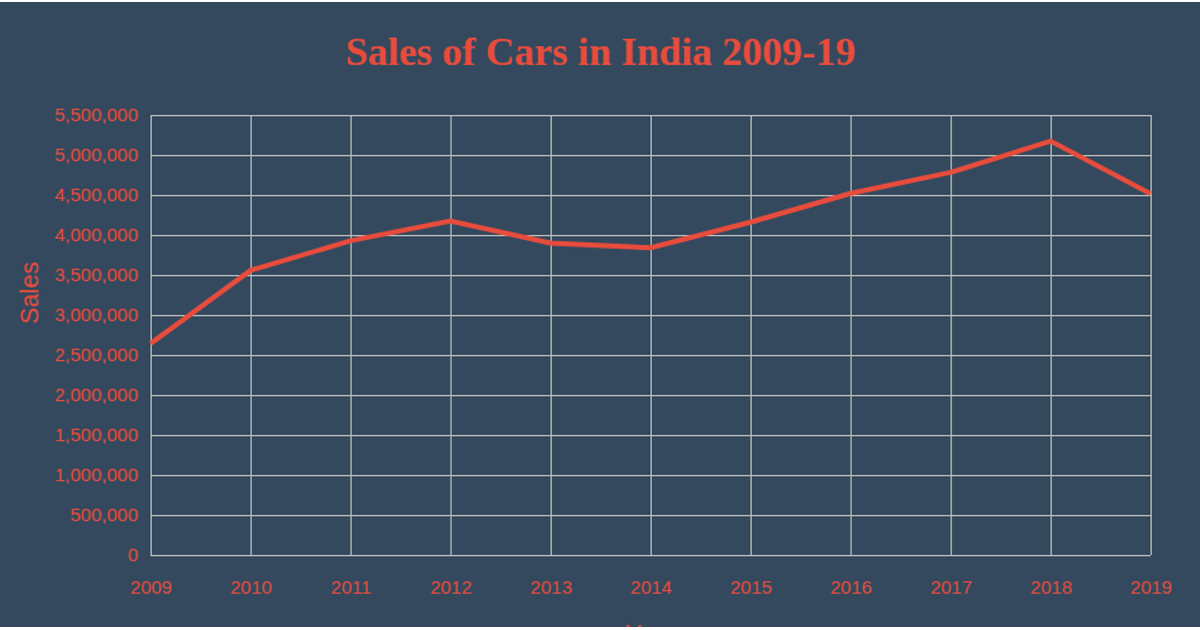
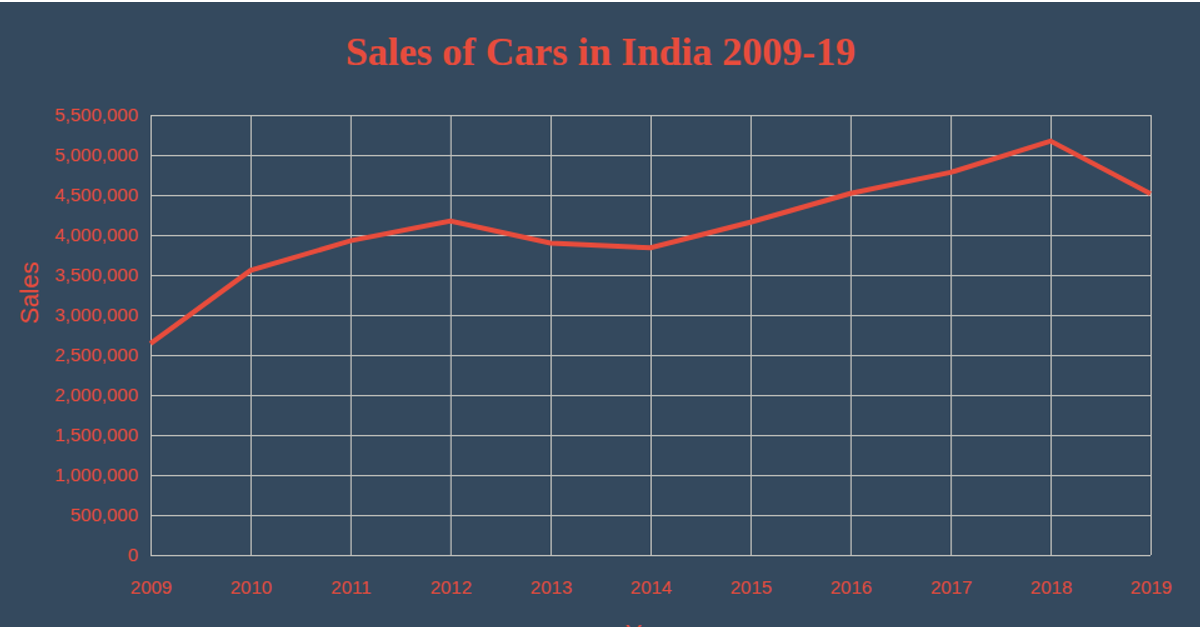
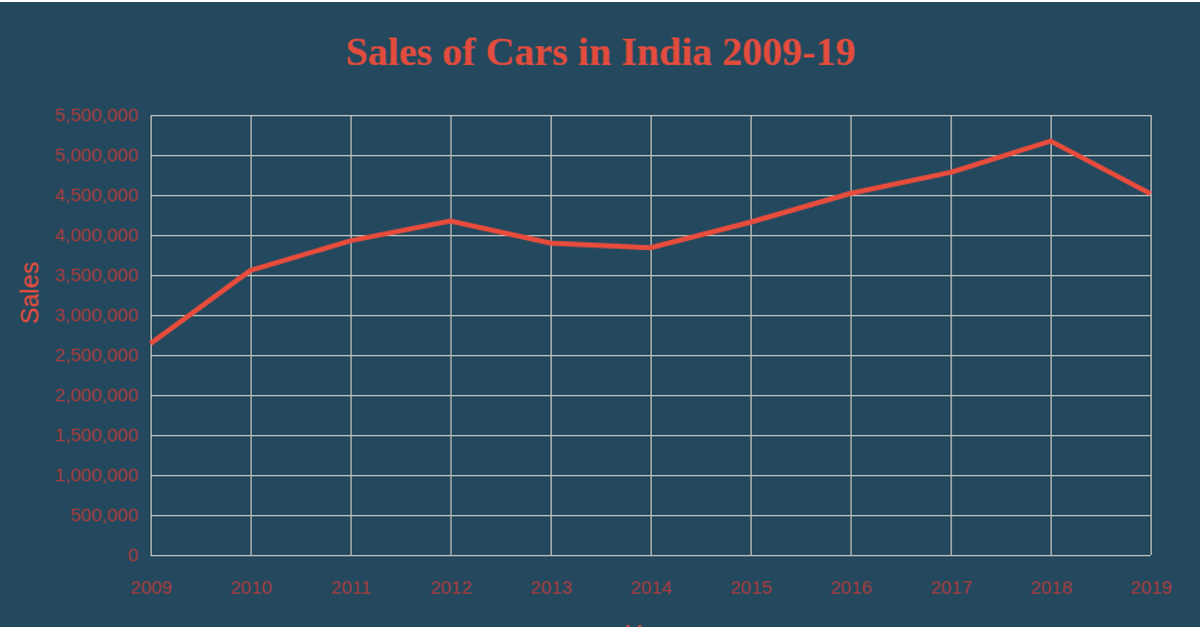
This line chart displays the number of property-recovered cases in India from 2001 to 2010. It uses D3 v5’s `scaleTime` and `scaleLinear` to map years and case counts, with `axisBottom` and `axisLeft` for labeled axes and a `line` generator for the red trend path. Data comes from a CSV file loaded via `csv`, and the visualization is rendered as an SVG with custom margins and gridlines.
AI-generated descriptionA demonstration of how to start using D3 version 6.
MIT Licensed




Comments
Sign in to join the discussion.