🌍 Public
Fork of ICE 7 Line Chart
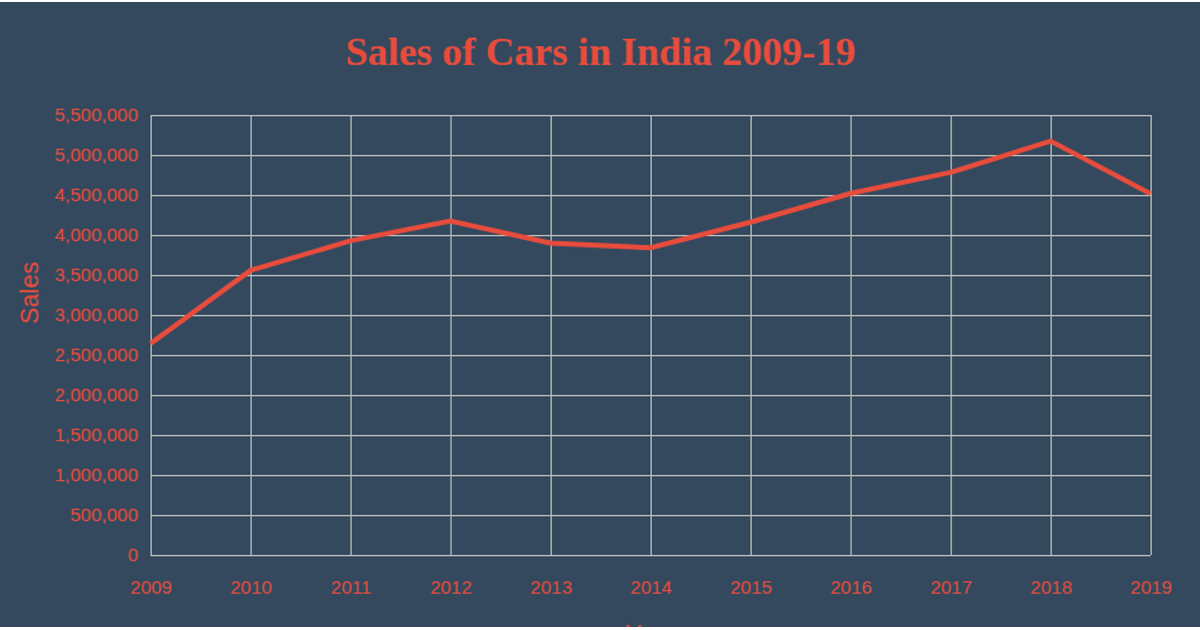
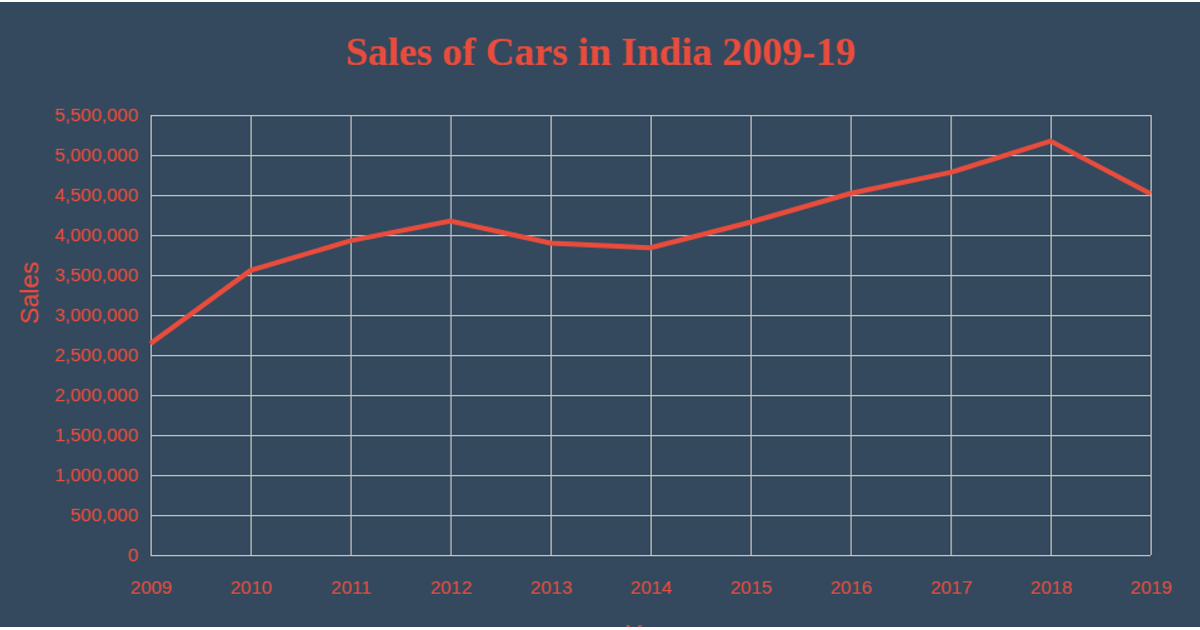
This fork of the ICE 7 Line Chart shows car sales in India from 2009 to 2019, plotting yearly sales against a time-scaled x-axis and a linear y-axis. The visualization uses d3.csv to load data, scaleTime and scaleLinear for axes, and d3.line to generate the single red path. Axis labels and ticks are rendered with axisBottom and axisLeft, while SVG groups position the chart within a fixed-width container. Styling emphasizes red text and grid lines against a dark blue background.
AI-generated descriptionMIT Licensed



Comments
Sign in to join the discussion.