Pseudo-Viz of Spacewalks
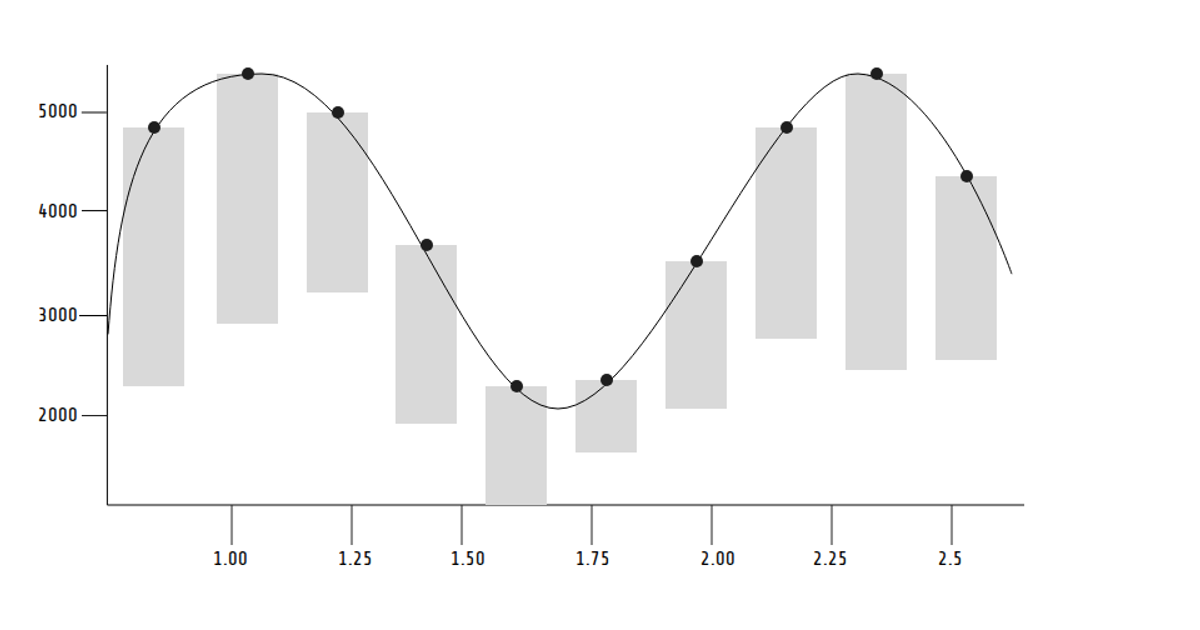
This pseudo-visualization uses horizontal bars to show the duration of spacewalks, with their lengths proportional to the data values. Overlaid circles use categorical colors to distinguish different spacewalkers, each positioned at a corresponding vertical index. The visualization employs the d3 selection API to build the SVG scene, combining a `length` module that renders rectangles with a `hue` module that draws colored circles. The data is a simple array of five values, and the design imitates a rough sketch of spacewalk tracks.
AI-generated descriptionHere I attempted to use length and hue to create a rough form of my Spacewalks illustration. In that illustration I wanted to extend lines that imitated a "spacewalk".
The length of the spacewalks will represent the duration of said spacewalk. The circles from hue are meant to distinguish different spacewalkers associated with each spacewalk.






Comments
Sign in to join the discussion.