🌍 Public
Psuedo Visualisations Code Along (Episode 2)
GGautam Doshi
Last edited Jul 11, 2024
Created on Jul 9, 2024
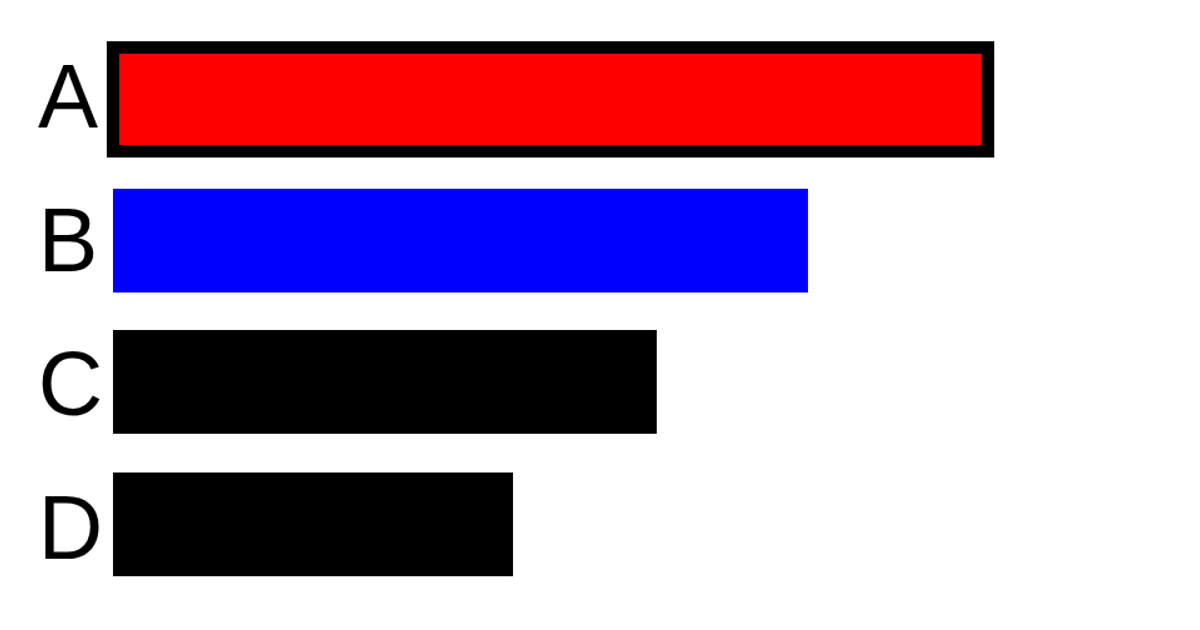
An approximate bar plot shows five labeled categories with varied rectangular bar lengths on a blank canvas. Each bar uses raw SVG `rect` elements, with the first bar styled via a CSS class and the remaining bars filled with a solid red color. Text labels are positioned manually using SVG `text` elements, and the entire visualization is rendered within a fixed 501×389 viewBox.
AI-generated descriptionAn approximation of a bar plot
MIT Licensed



Comments
Sign in to join the discussion.