🌍 Public
shuttle
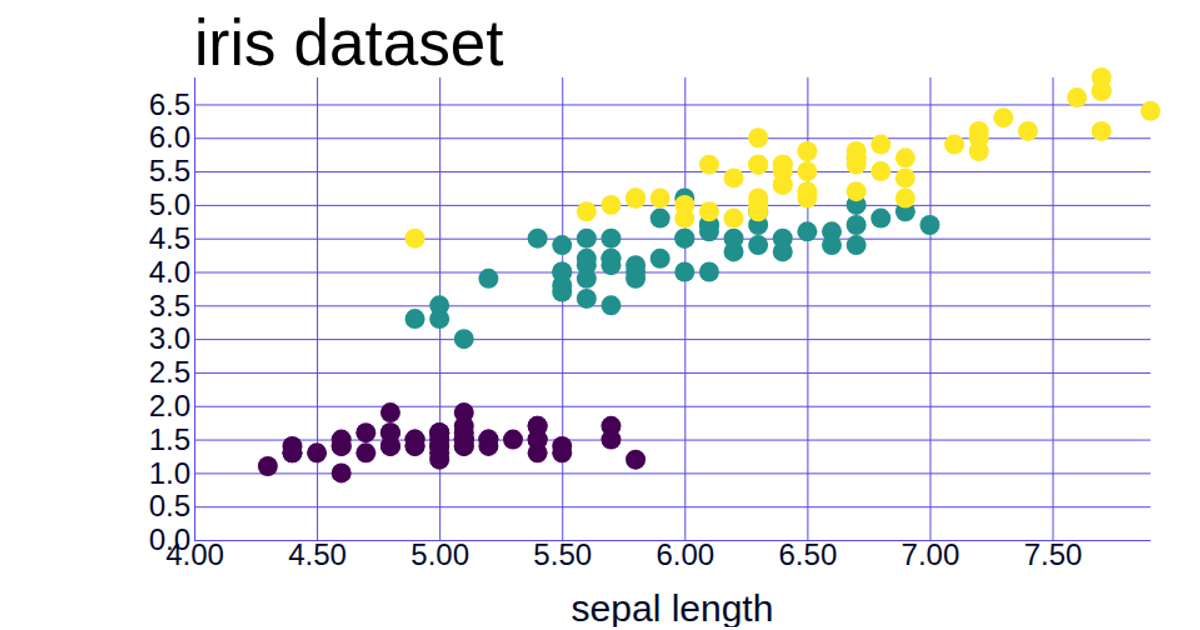
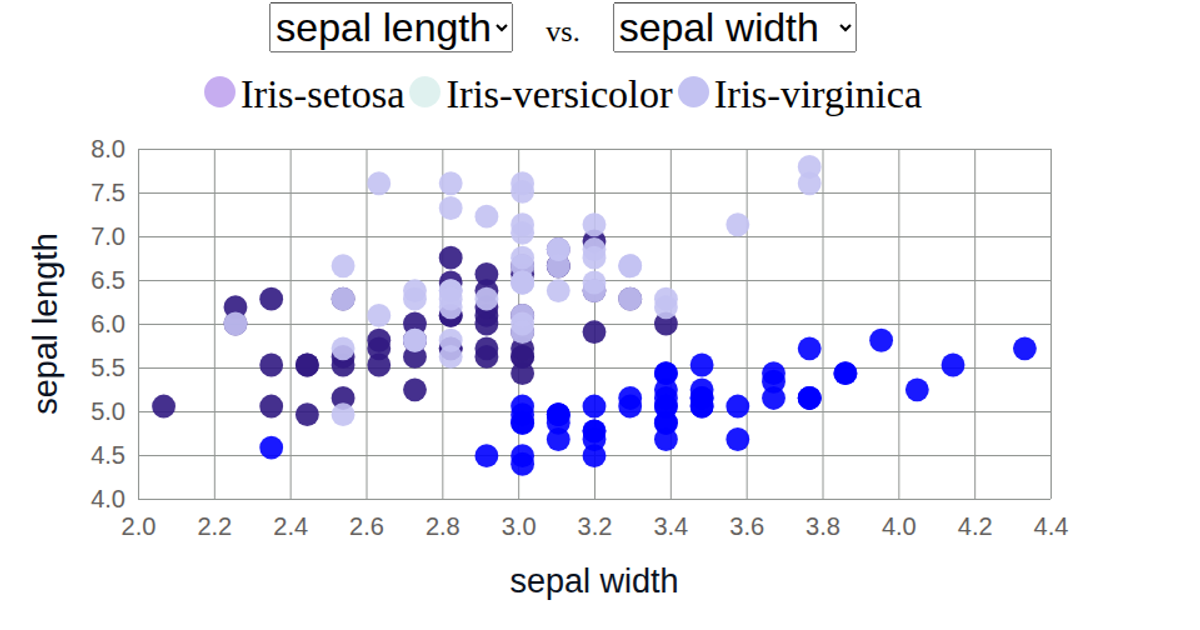
This visualization displays the Iris dataset as a scatter plot comparing sepal length against sepal width, with species shown as colored points and an interactive legend that fades non-hovered categories. The visualization uses d3.csv to load data from a CSV file, d3.scaleLinear for both axes, and d3.scaleOrdinal for color encoding. It includes a legend with mouseenter and mouseleave events that trigger opacity changes to highlight selected species. The code also uses d3.axisBottom and d3.axisLeft for chart axes.
AI-generated descriptionMIT Licensed




Comments
Sign in to join the discussion.