🌍 Public
ice6barchart shivani
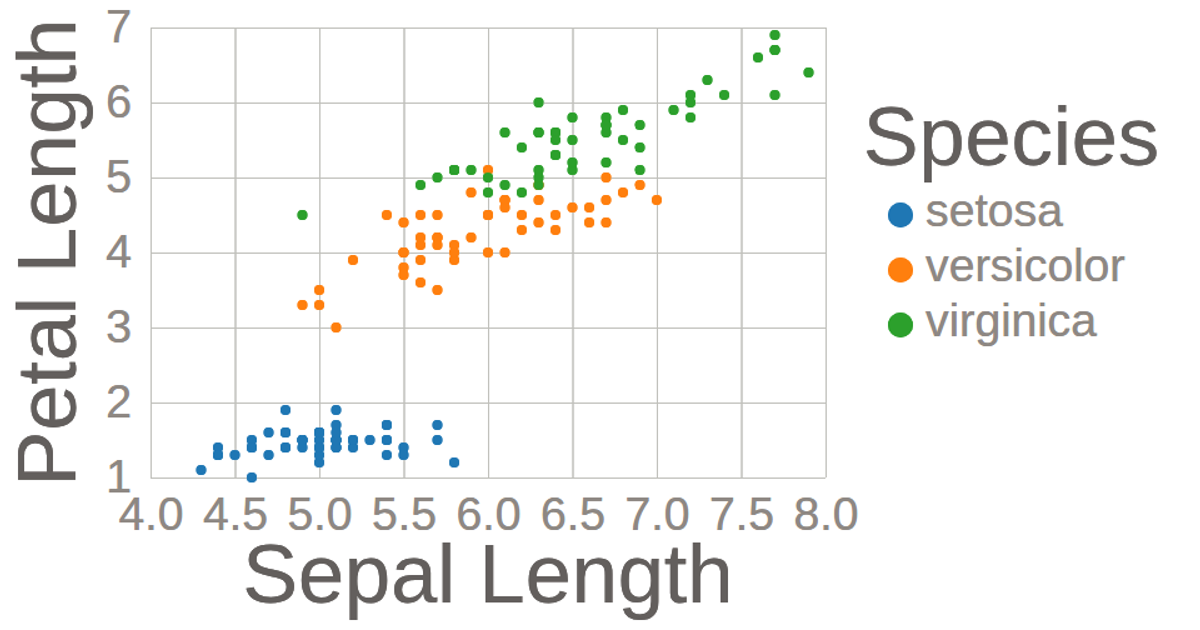
This scatter plot visualizes the Iris dataset, comparing sepal length and width across three flower species with color-coded points. The chart includes hover interactivity through its legend, which highlights and fades points by species. Built with D3 v7, it uses `scaleLinear`, `scaleOrdinal`, `axisBottom`, and `axisLeft` to render the SVG visualization, with data loaded from a CSV via `d3.csv`.
AI-generated descriptionMIT Licensed



Comments
Sign in to join the discussion.