🌍 Public
papa Africa map
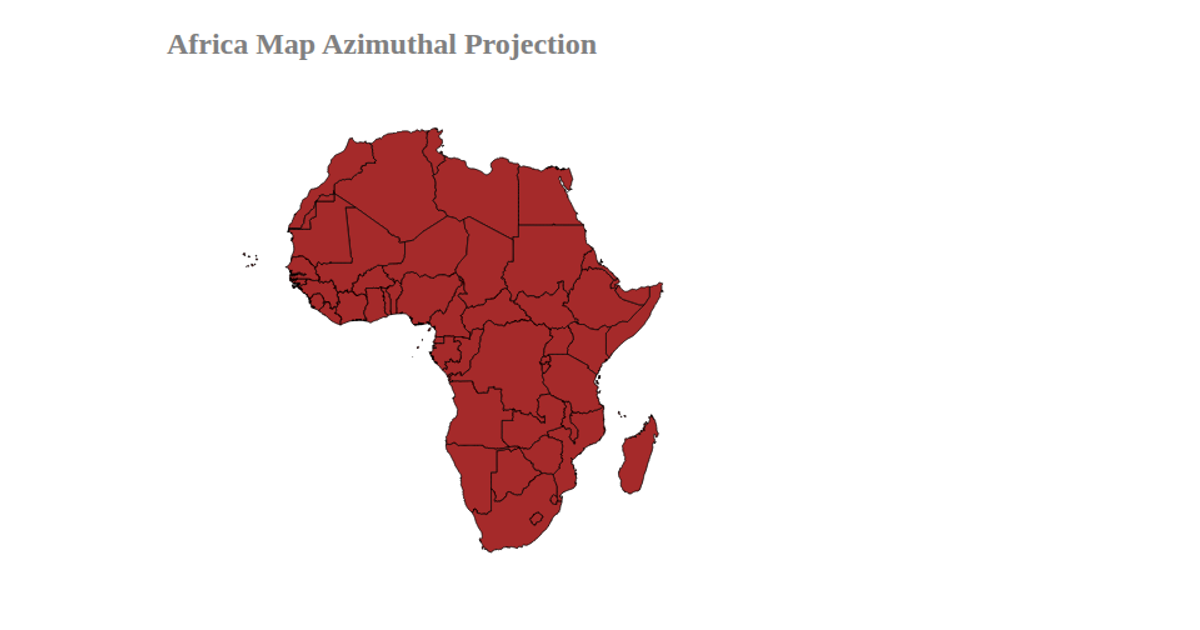
This example displays a map of Africa rendered with an AzimuthalEqualArea projection, highlighting the continent’s countries in blue with white borders. The visualization loads geographic data from a GitHub gist and uses D3 v4’s `d3.geoPath` and `d3.geoMercator` to project and draw the SVG paths. Additionally, it incorporates the `d3-geo-projection` library, though the active projection is Mercator. The map is centered within an SVG container, with a title indicating the intended projection.
AI-generated descriptionA bare minimum HTML page demonstrating use of CSS and JavaScript.
See also React Starter.
MIT Licensed






Comments
Sign in to join the discussion.