🌍 Public
Fork of Tree Structure- ICE 8_Archana Goli
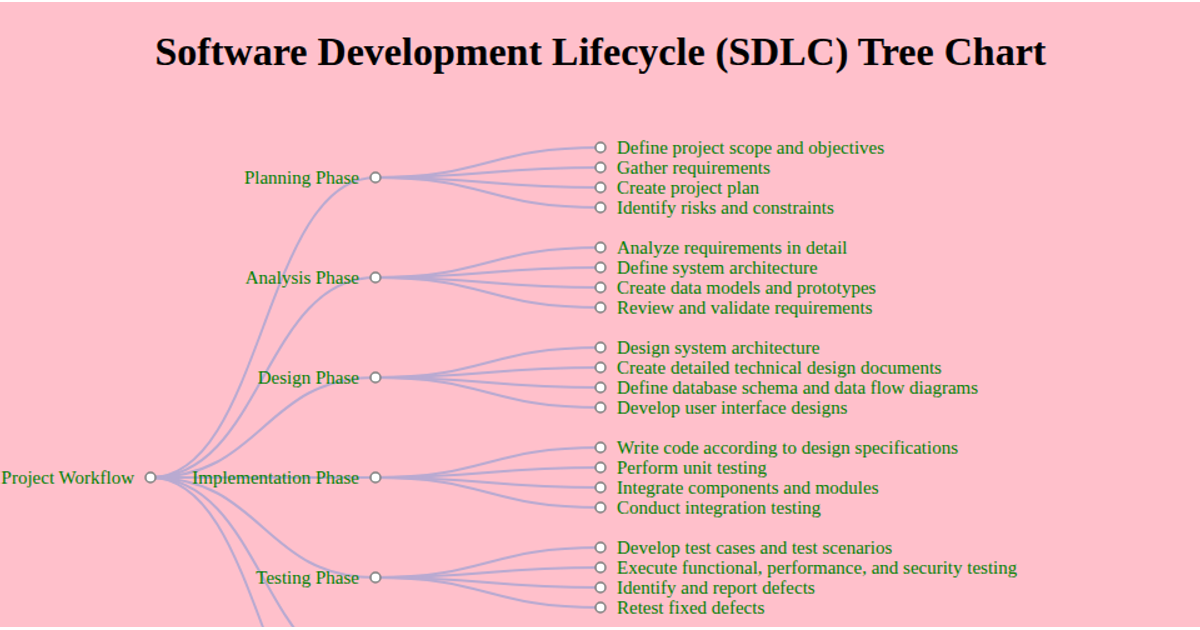
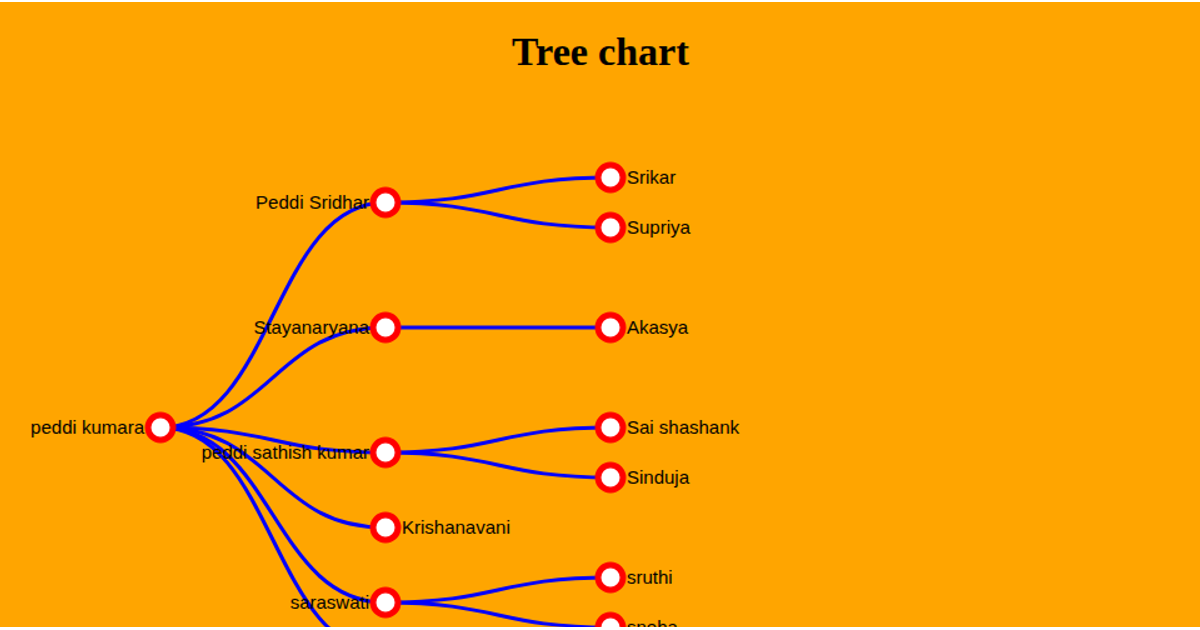
This interactive tree chart visualizes the Software Development Lifecycle (SDLC) as a hierarchical workflow. The root node branches into six main phases—Planning, Analysis, Design, Implementation, Testing, and Deployment—each with four child nodes detailing specific tasks. Built with the D3.js library (v3.5.17), the SVG-based visualization uses circle nodes and link strokes, with violet node fills and custom styling. The tree data is defined as a JavaScript array, and the layout renders in a static, non-animated format, relying on CSS for visual customization.
AI-generated descriptionA bare minimum HTML page demonstrating use of CSS and JavaScript. .
MIT Licensed



Comments
Sign in to join the discussion.