🌍 Public
Tree Structure- ICE 8_Archana Goli
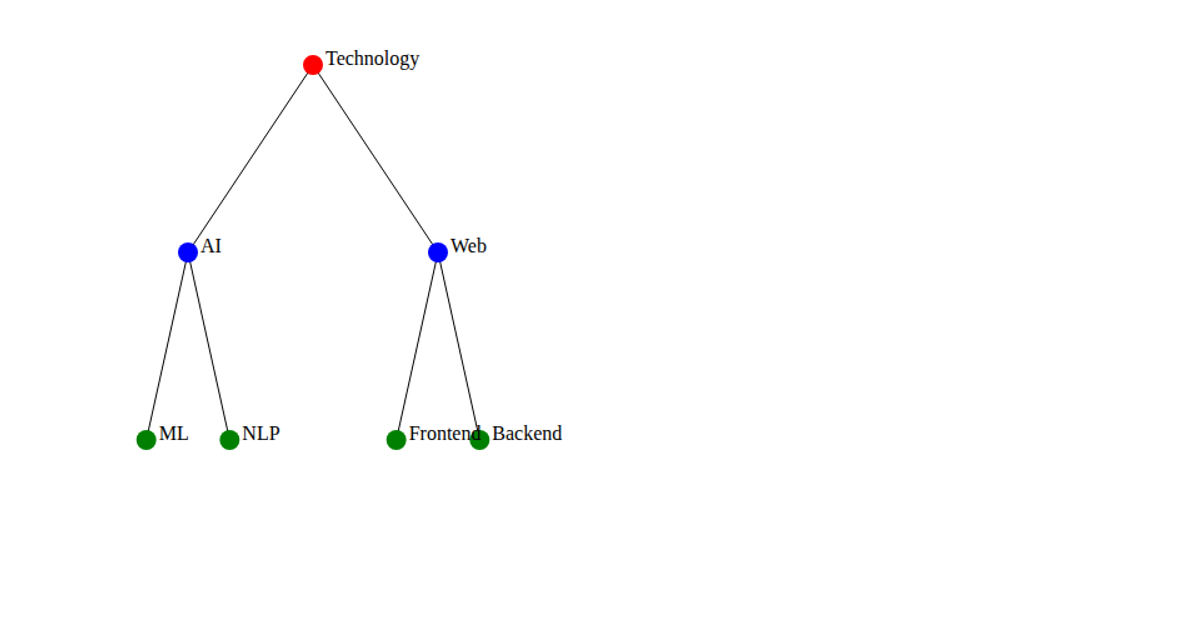
This interactive tree chart depicts a Software Development Lifecycle (SDLC), visualizing six primary phases—from Planning through Deployment—that branch from a central "Project Workflow" root. Each phase expands into four specific task-oriented leaf nodes, revealing the hierarchical structure of the process. Rendered with the D3.js library (version 3.5.17) and SVG, the visualization uses interconnected circles and text labels in an animated layout. The chart is styled with custom CSS, featuring violet nodes, green text, and pink page background to clearly distinguish the various workflow components.
AI-generated descriptionA bare minimum HTML page demonstrating use of CSS and JavaScript. .
MIT Licensed




Comments
Sign in to join the discussion.