🌍 Public
Making a barchart
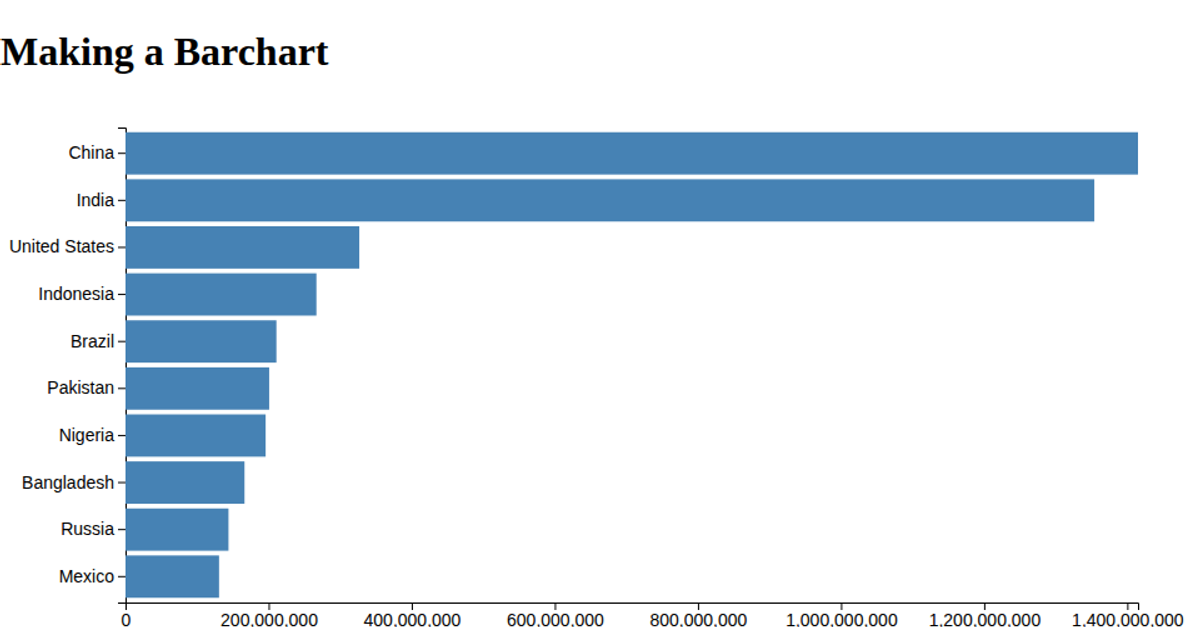
This bar chart displays population totals for five countries, with rectangles sized according to each nation’s population value. The visualization uses D3 v6 APIs including `csv`, `scaleLinear`, `scaleBand`, `axisLeft`, and `axisBottom` to load data from a CSV file, map values to positions, and render axes. The SVG chart applies a steelblue fill to bars, with margins and a padded band scale for categorical spacing. Data is parsed from strings to numbers before rendering.
AI-generated descriptionMIT Licensed




Comments
Sign in to join the discussion.