🌍 Public
Stylized bar chart
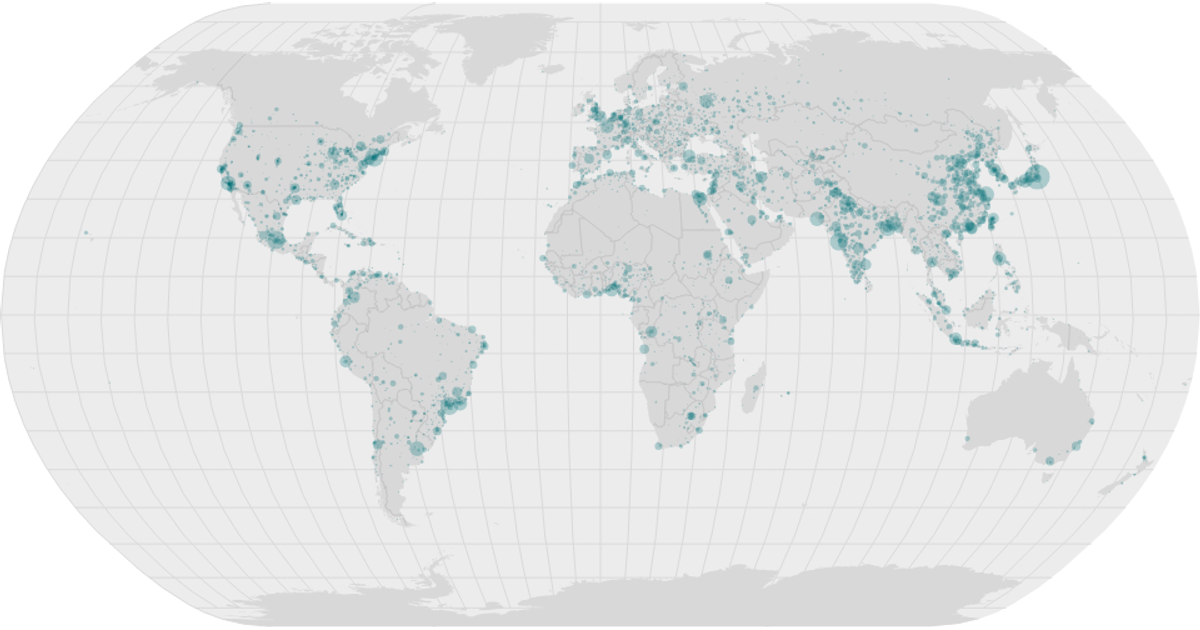
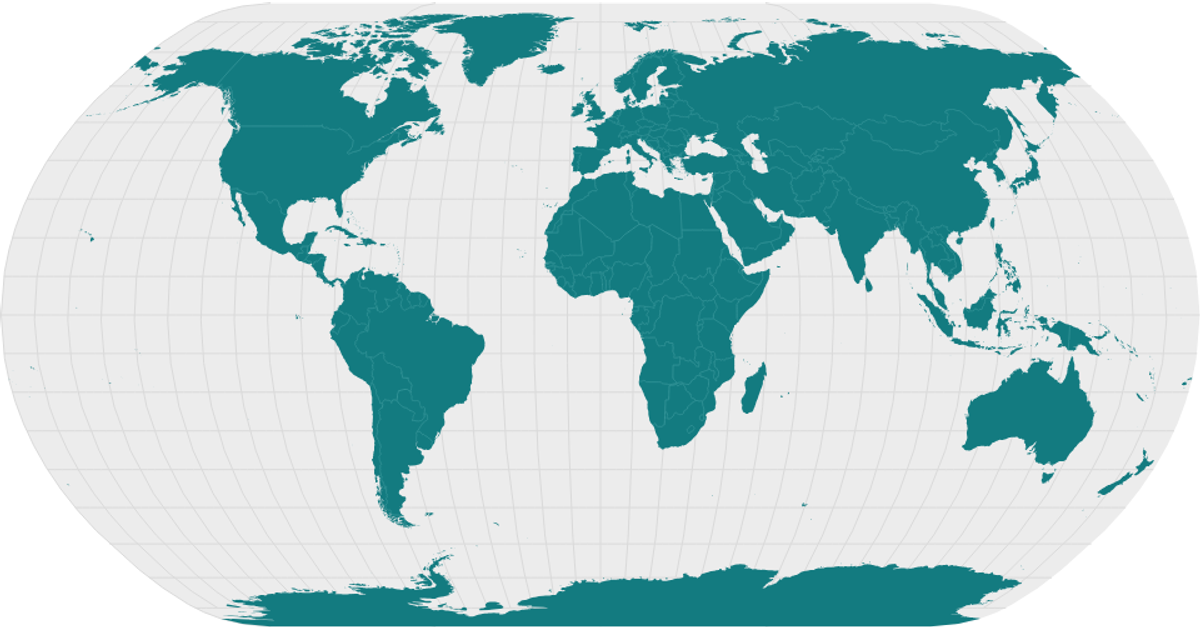
This visualization shows the world’s countries as stylized filled regions, with a natural Earth projection and graticule. It overlays circles for major cities, sized by population using a square-root scale. The map is rendered in SVG, using React for component structure, and relies on d3.geoNaturalEarth1, d3.geoPath, and d3.geoGraticule for geographic projection and paths. Data comes from the World Atlas TopoJSON and a clean CSV of world cities.
AI-generated descriptionA program that shows the top 10 most populous countries as a pathetic bar chart with no axes.
MIT Licensed




Comments
Sign in to join the discussion.