🌍 Public
Fork by Jeevani ICE 8
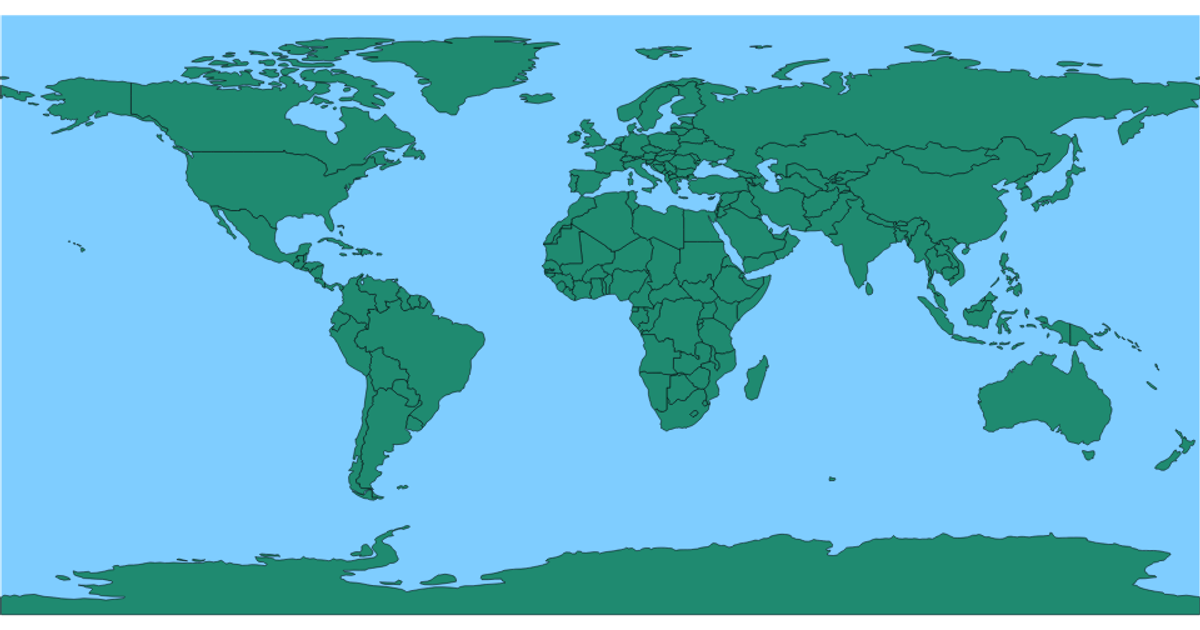
This example displays a world map with an equirectangular projection, coloring all countries in pink against a blue sphere, and highlighting countries in gold on hover. The visualization loads country boundaries from the world-atlas TopoJSON/GeoJSON dataset and renders them as SVG paths. Built with D3 v5, it uses `d3.geoPath` for path generation, `d3.geoEquirectangular` for the projection, and the TopoJSON `feature` method to convert TopoJSON data into GeoJSON features. The styles handle the sphere fill, country stroke, and hover effects.
AI-generated descriptionMIT Licensed





Comments
Sign in to join the discussion.