🌍 Public
Bargraph
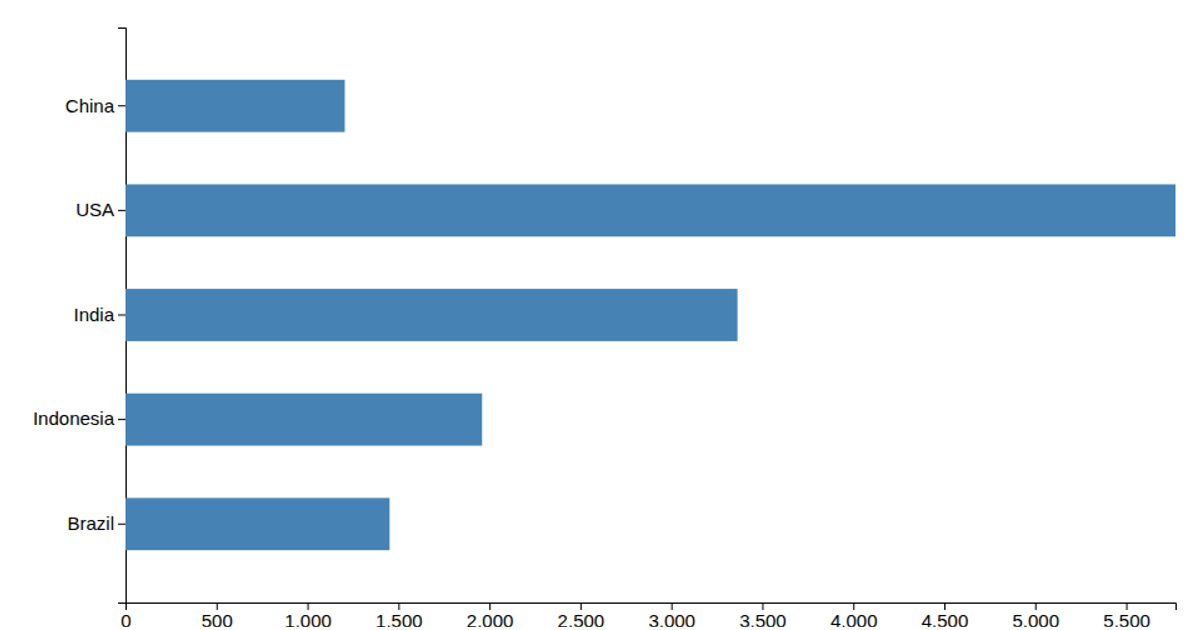
This bar chart shows CO₂ emissions for a wide range of countries and global groupings, ordered by descending value. It uses D3’s `scaleBand` and `scaleLinear` to map country names and emission values to the canvas, and draws steel-blue rectangles for each bar. Axis ticks are generated with `axisBottom` and `axisLeft`, while rotated labels and explicit axis titles clarify the country and emissions units. The data is read from a CSV file.
AI-generated descriptionMIT Licensed




Comments
Sign in to join the discussion.