🌍 Public
HTML Starter
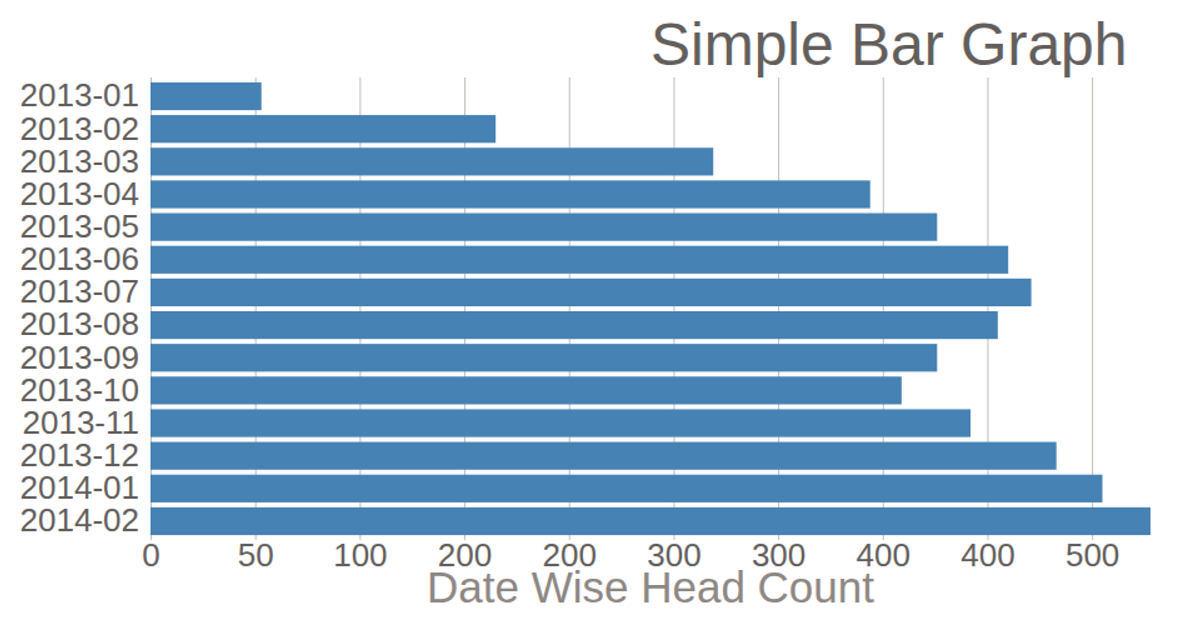
This bar chart displays the monthly CKYC success count for 2020, with months on the y-axis and record counts on the x-axis. The visualization uses D3 v5, loading data from a CSV file and rendering as an SVG. It employs `scaleLinear` and `scaleBand` for axes, with bars styled via CSS. The chart includes axis labels and a title, generated through `axisLeft` and `axisBottom`.
AI-generated descriptionThis bar chart shows CKYC success count of 2020 on month wise.
MIT Licensed




Comments
Sign in to join the discussion.