🌍 Public
CKYC Bar Chart
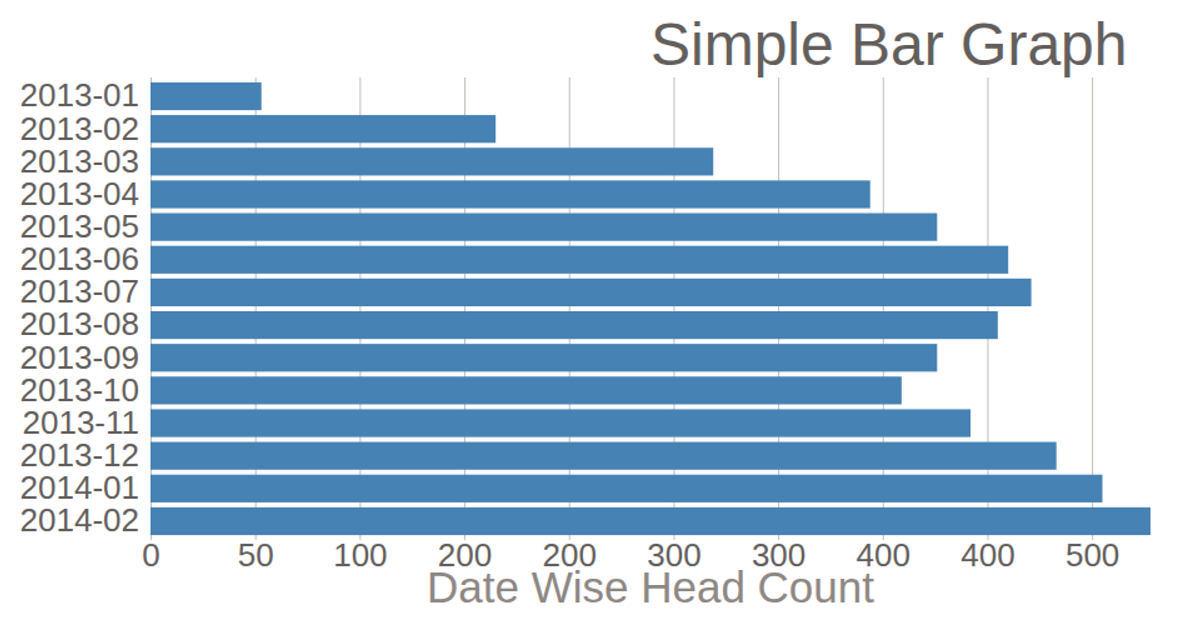
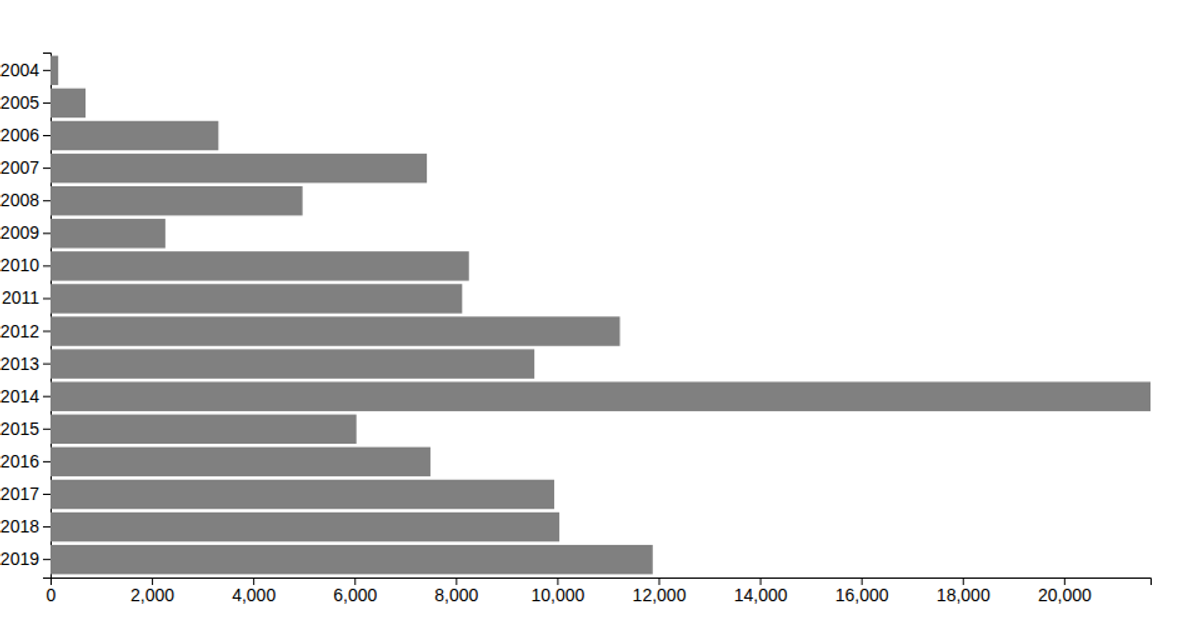
This bar chart visualizes the month-wise count of CKYC successes for 2020, showing a clear downward trend from January through June. The chart uses D3 v5 to render SVG elements, employing `scaleBand` for the categorical month axis and `scaleLinear` for the record count axis. Data is loaded from a CSV file containing two columns: Month and RecordCount. The visualization includes axis labels and a title, with grid lines styled via CSS.
AI-generated descriptionThis bar chart shows CKYC success count of 2020 on month wise.
MIT Licensed






Comments
Sign in to join the discussion.