🌍 Public
Fork of Bar graph-task1
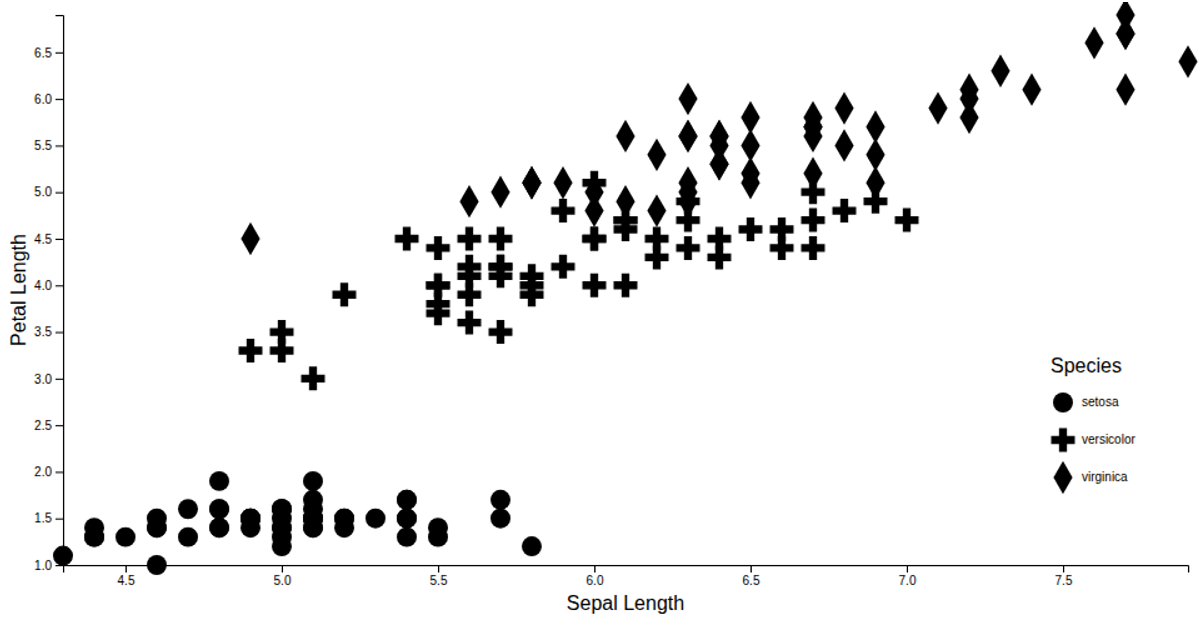
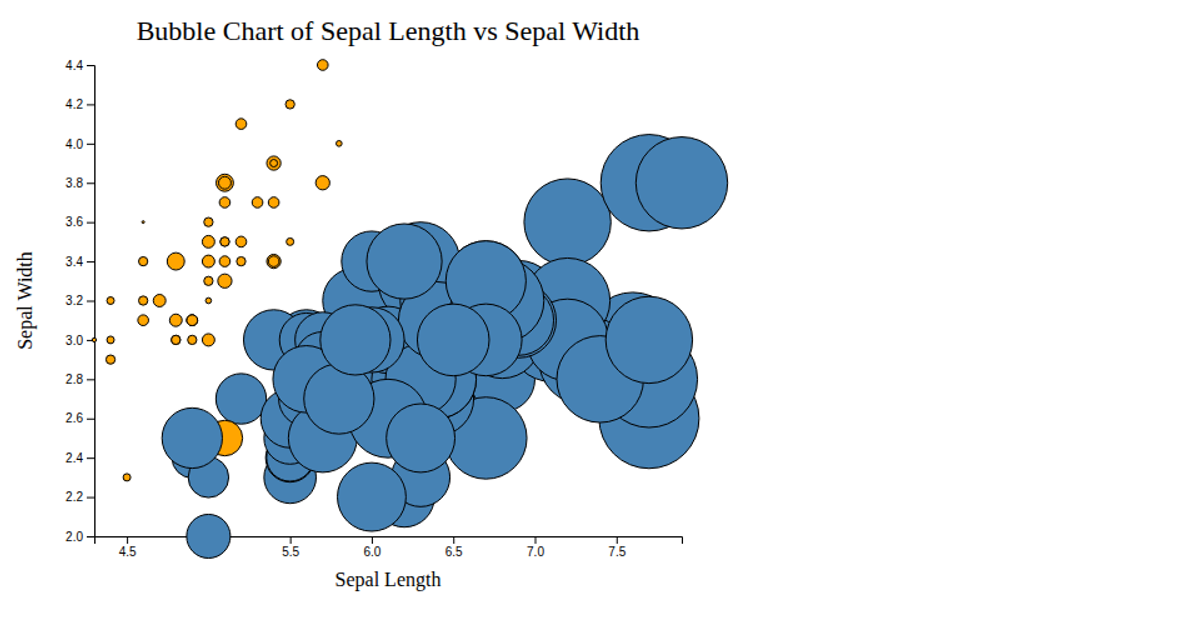
This fork of the bar graph task visualizes the Iris dataset, mapping sepal length to bar height. The SVG-based chart renders bars for each observation, with the variety column used to color-code the three species (Setosa, Versicolor, and Virginica). Rendered as a bar graph, the visualization provides a clear comparison of sepal length values across the dataset, leveraging the v3 source implementation by Tarun-B-12 under the MIT license.
AI-generated descriptionMIT Licensed


Comments
Sign in to join the discussion.