🌍 Public
Fork of Activity6_Task4.9
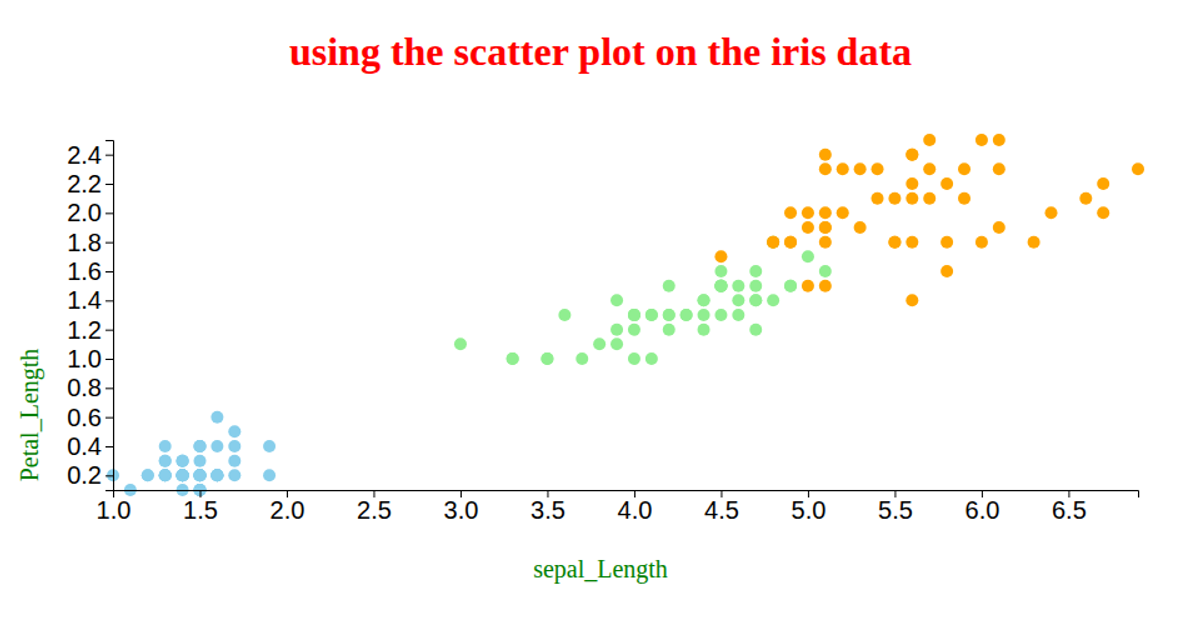
This visualization is a bubble chart of the Iris dataset, plotting sepal length on the x-axis against sepal width on the y-axis, with each bubble’s radius representing petal length. The chart uses D3 v7 to load the data from a CSV file, create linear scales for positioning and sizing, and render the bubbles as SVG circles. A simple color rule distinguishes flowers with petal length greater than three (steelblue) from those below (orange), with black strokes and hover opacity changes.
AI-generated descriptionMIT Licensed



Comments
Sign in to join the discussion.