🌍 Public
CS599 Project 5 - Bar Chart
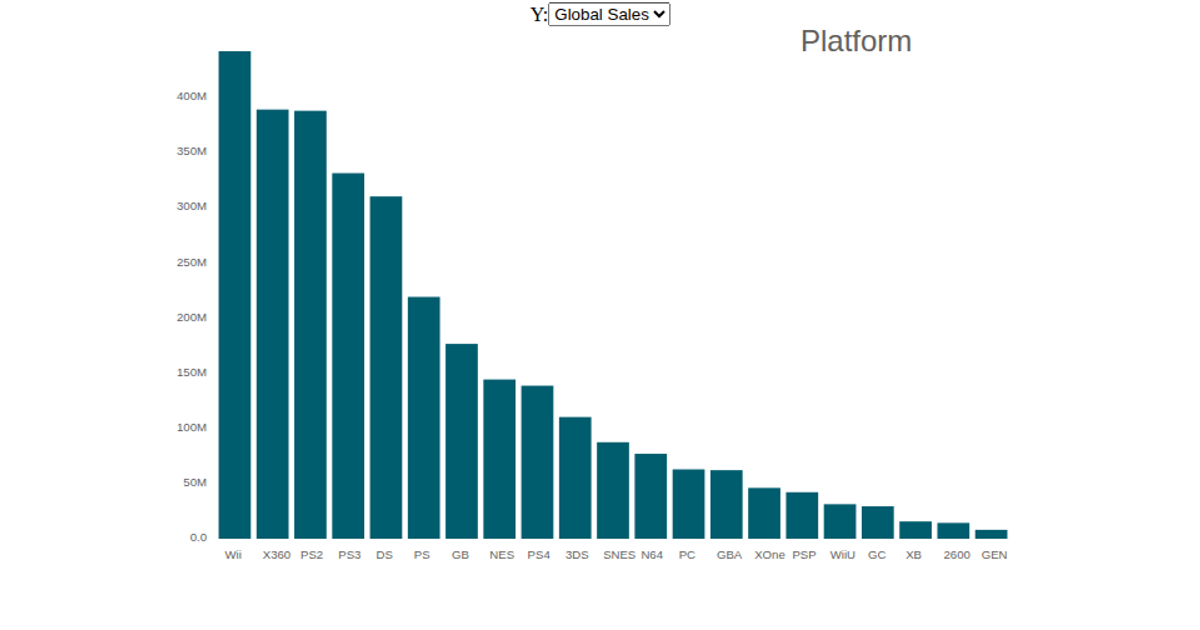
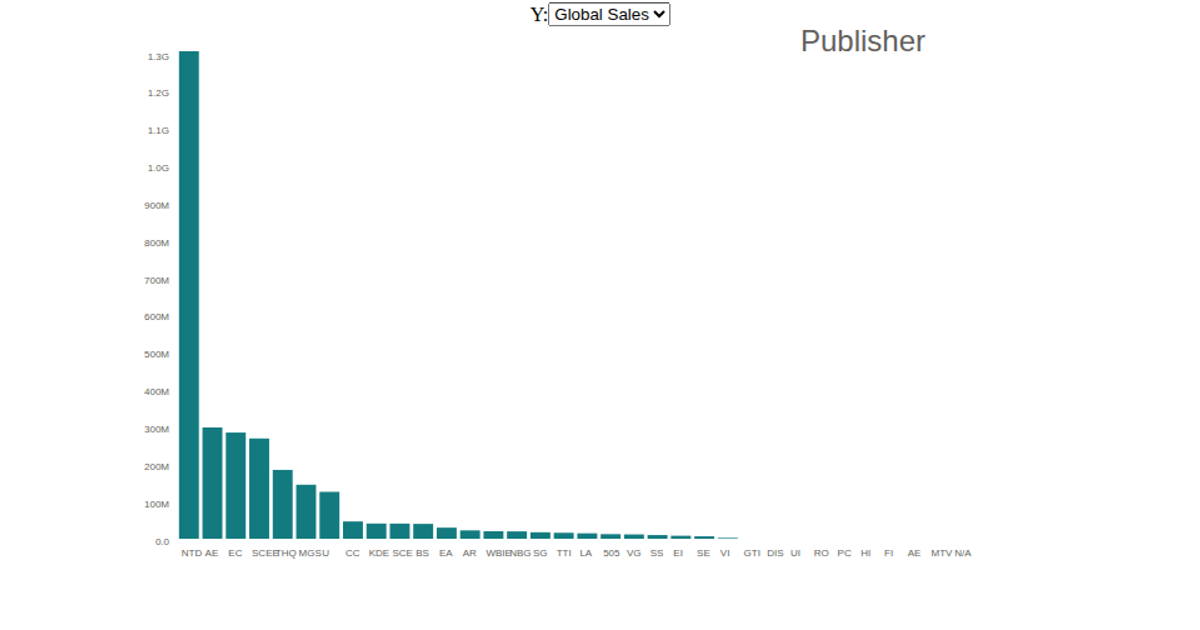
This bar chart displays the number of game consoles each major publisher has released, using red, semi-transparent bars and a grid of platform labels beneath each publisher. It reads publisher and console data from a CSV file and renders the visualization as SVG using d3.v6. The chart uses `scaleBand` for the x-axis, `scaleLinear` for the y-axis, and `axisBottom` and `axisLeft` for the axes. Additionally, it overlays fixed-position images of game consoles and text labels for Xbox 360, Nintendo Switch, and PlayStation 2.
AI-generated descriptionMIT Licensed




Comments
Sign in to join the discussion.