🌍 Public
D3JS bar chart custom axis
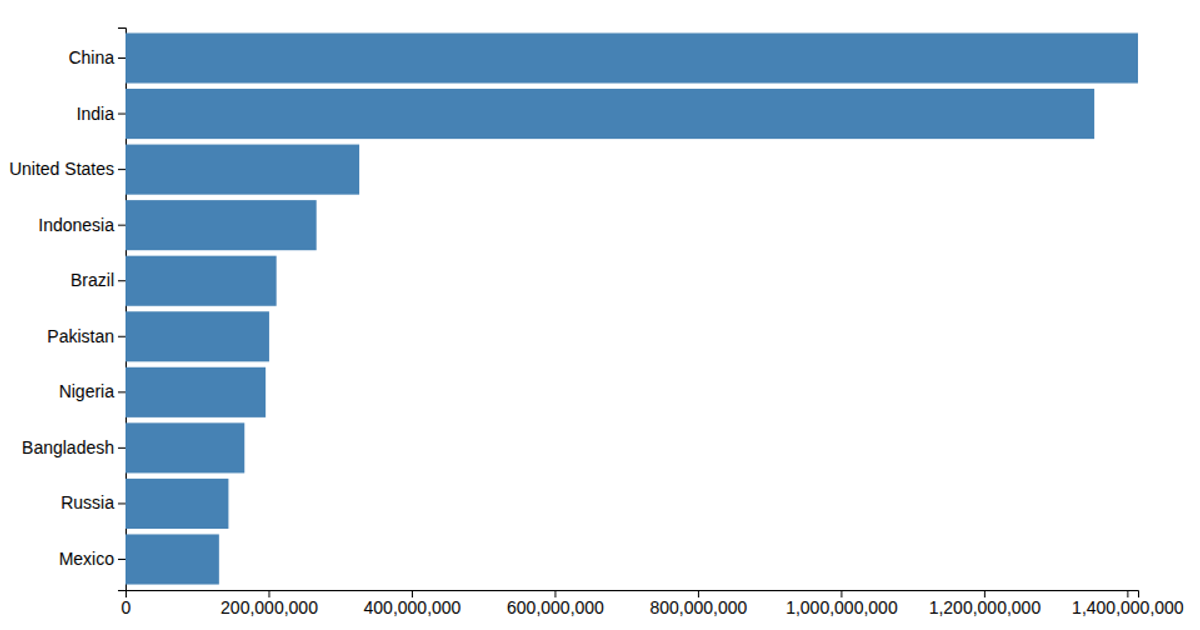
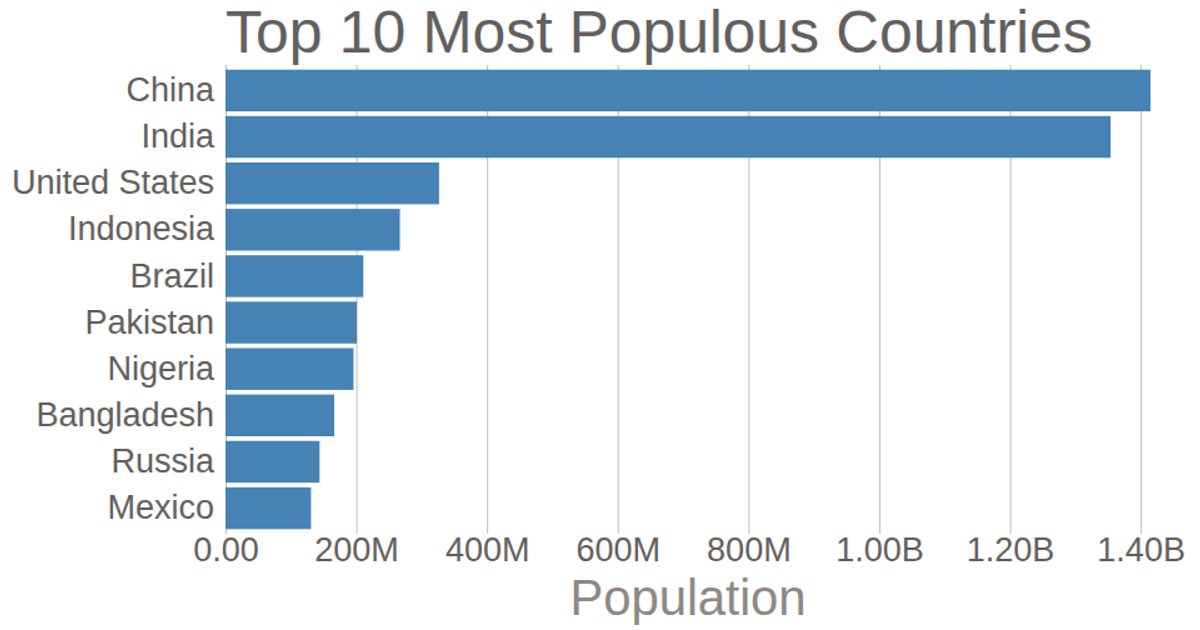
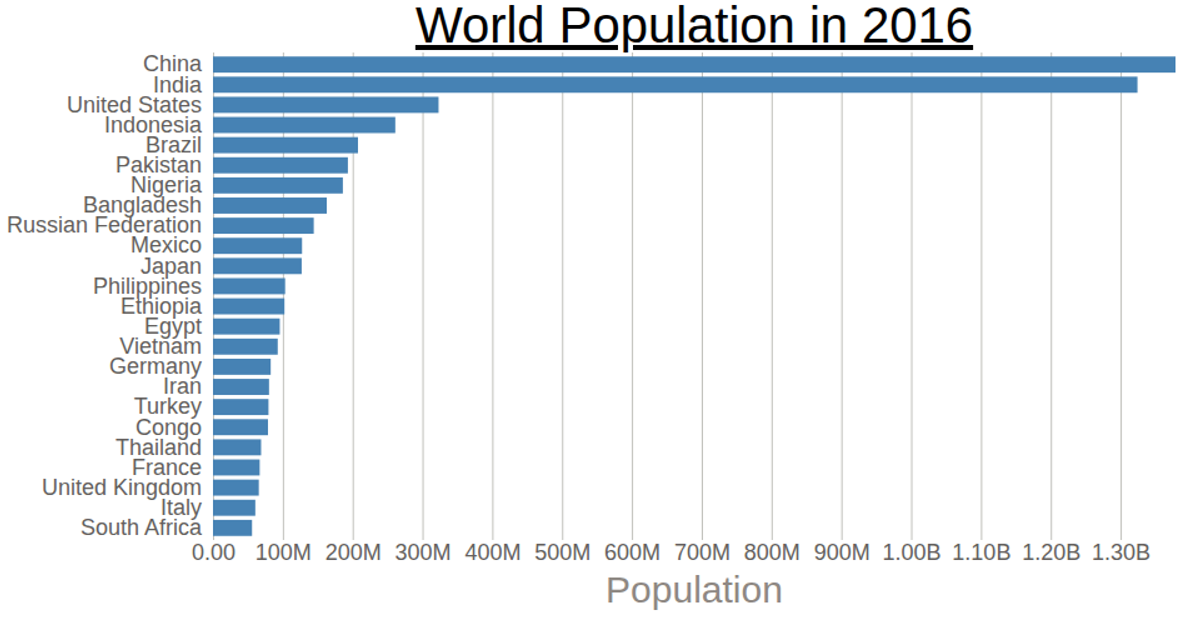
A D3.js v6 bar chart displays population counts for nine countries using an SVG rendering with a custom horizontal axis. The axis converts D3’s default SI-prefix formatting (like “1.4G”) into readable labels using “B” for billions via `axisBottom` and `format('.3s')`. The vertical axis uses a band scale for country names, while bar widths come from a linear scale over population values loaded from a CSV file.
AI-generated descriptionMIT Licensed




Comments
Sign in to join the discussion.