🌍 Public
Opo Cities
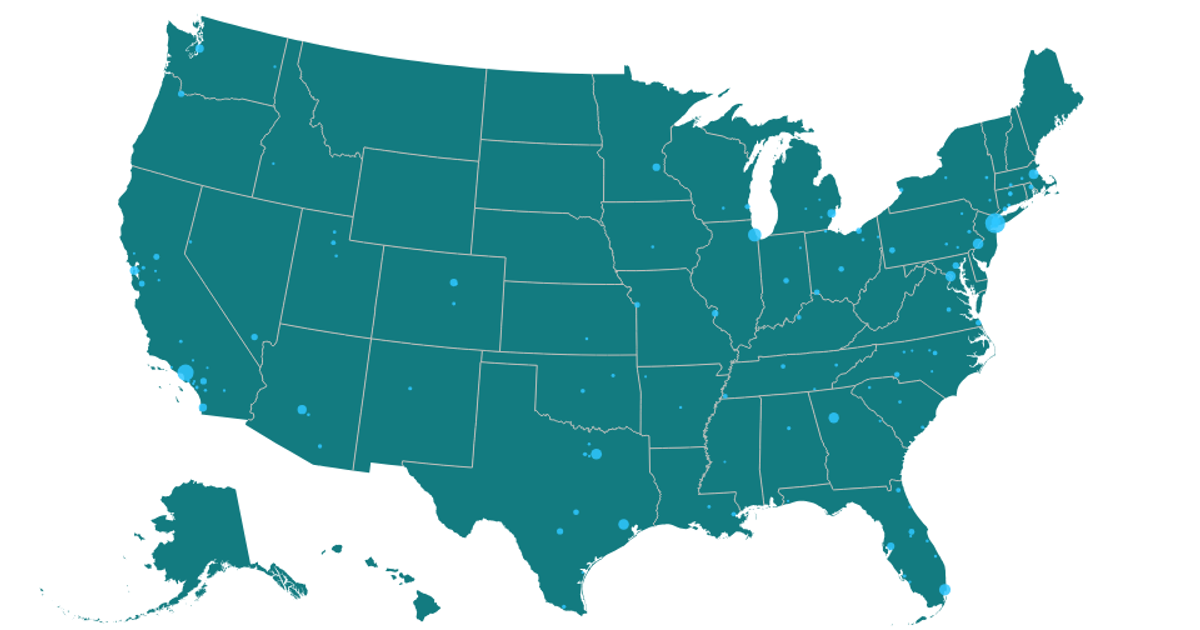
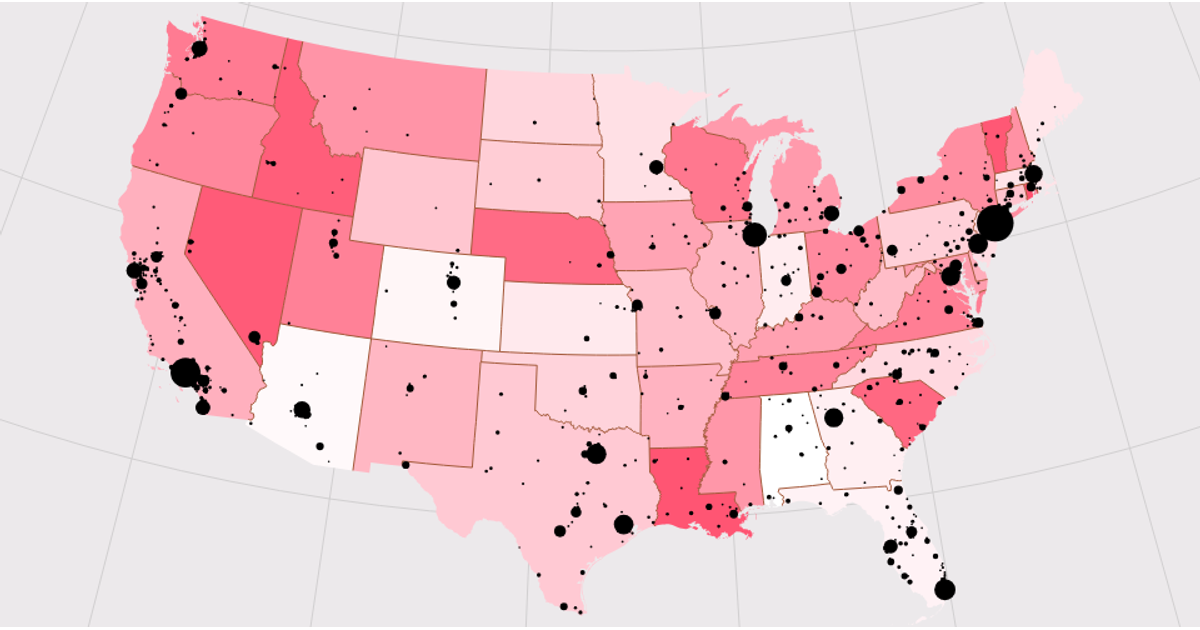
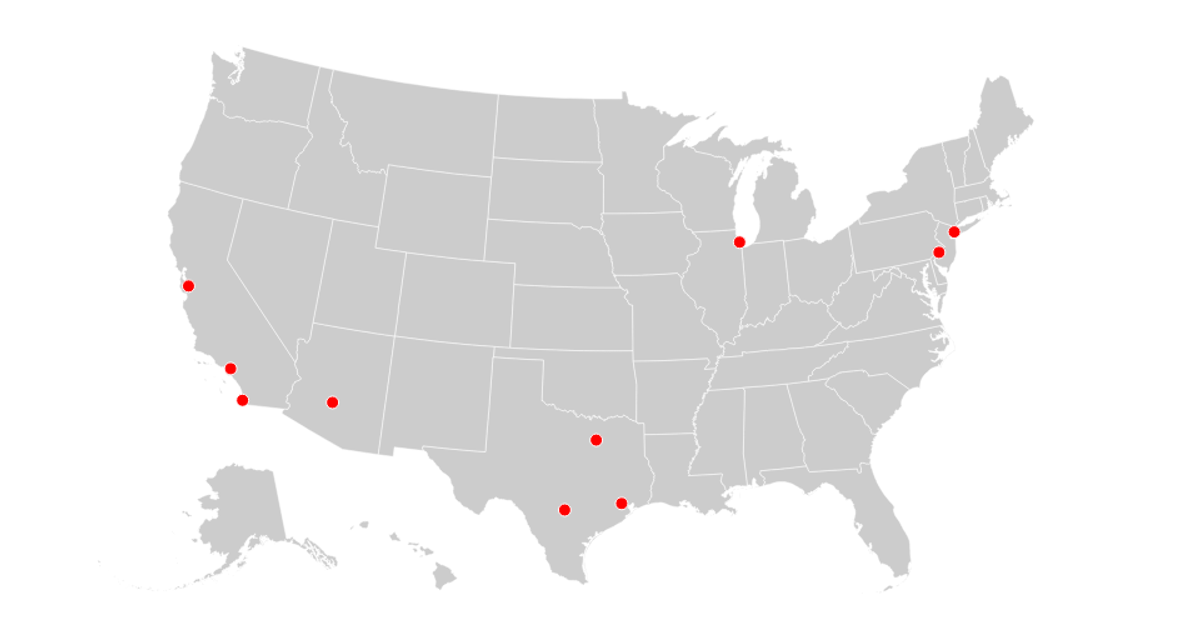
The visualization depicts the geographic distribution of "opo" cities across the United States, with a dark landmass and circles sized proportionally to the number of centers in each city. Using React with D3 v5, it renders an Albers equal-area projection via `d3.geoPath`, plotting map features from the US Atlas TopoJSON and city coordinates from a CSV file. The circles’ radii are scaled by the square root of the `Centers` attribute, providing a clear comparison of city significance.
AI-generated descriptionMIT Licensed




Comments
Sign in to join the discussion.