🌍 Public
Opo Tx Data Map
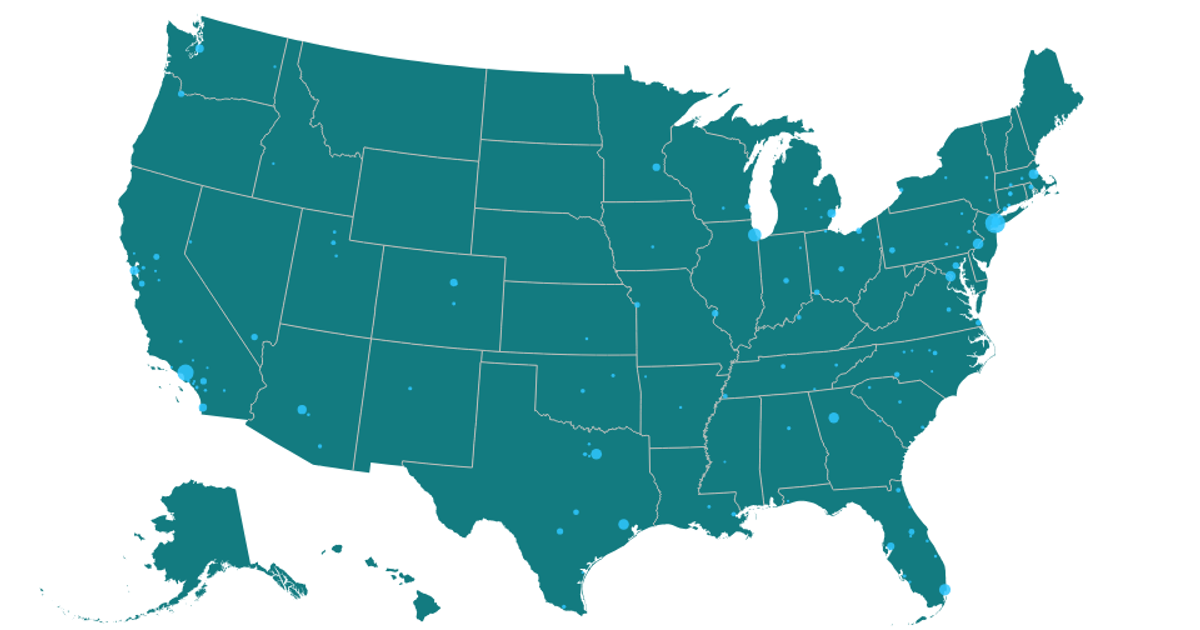
A map of the United States shows circles sized by the number of opioid treatment centers in each city, using a square-root scale. The geographic boundaries come from the US Atlas TopoJSON, while city coordinates are loaded from a CSV. The visualization uses `d3.geoAlbersUsa` and `d3.geoPath` to render state paths, and `d3.scaleSqrt` to map center counts to circle radii, all drawn in SVG within a React component.
AI-generated descriptionMIT Licensed





Comments
Sign in to join the discussion.