🌍 Public
BURRO VELHO
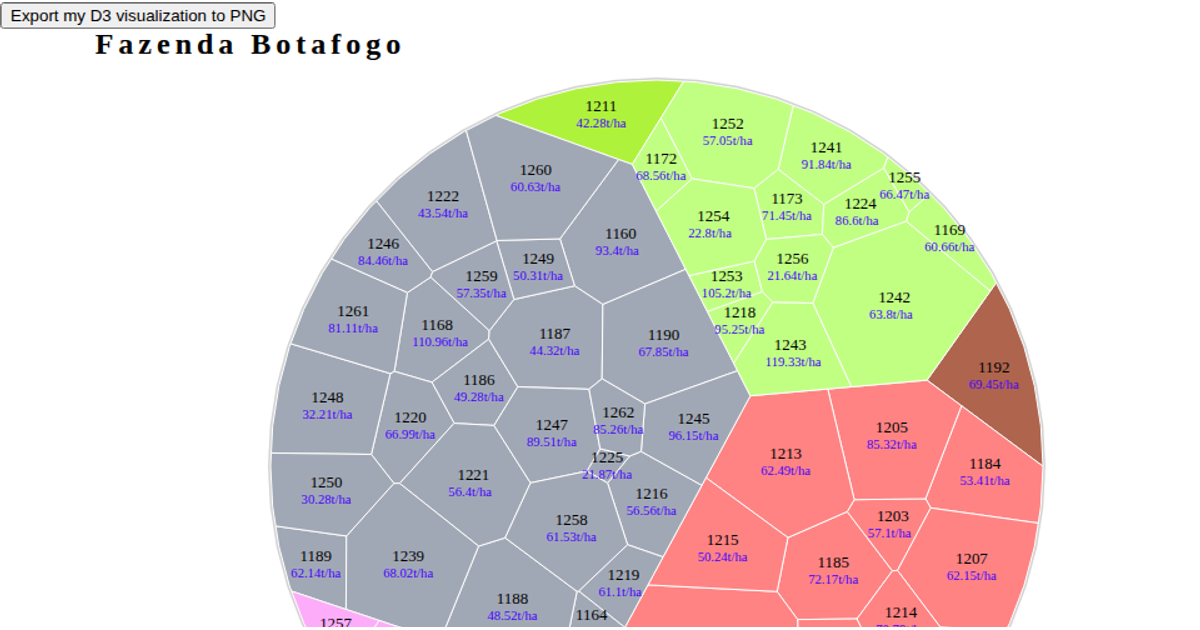
This visualization uses a Voronoi treemap to depict grouped data, with each colored region representing a category and its sub-regions sized by a weight value. The layout is computed with the `d3.voronoiTreemap` plugin, which relies on `d3.hierarchy` and a clipped polygon to generate the cell shapes. Regions are rendered as SVG paths with labels, and a legend maps the top-level colors to their names. The page also includes a button that exports the current SVG visualization to a PNG file using the Canvas API and FileSaver.js.
AI-generated descriptionA bare minimum HTML page.
See also React Starter.
MIT Licensed




Comments
Sign in to join the discussion.