🌍 Public
Itapipiré
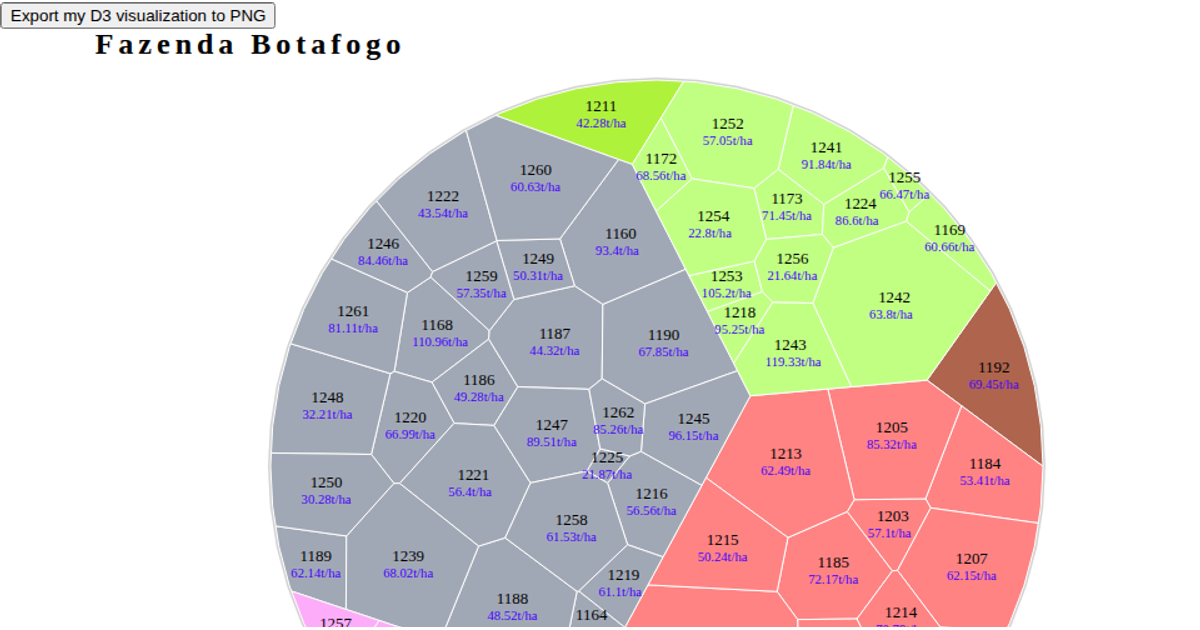
This visualization, titled "Itapipiré," displays a treemap of sugarcane variety weights using a circular layout clipped to a polygon, rendered with SVG. It uses the `d3.voronoiTreemap`, `d3-weighted-voronoi`, and `d3.voronoiMap` plugins on top of D3 v4, with data from a JSON file. The treemap cells are colored by parent category, with legends and a title overlaid. A button triggers PNG export via canvas-toBlob and FileSaver.js, though the core drawing remains SVG-based.
AI-generated descriptionA bare minimum HTML page.
See also React Starter.
MIT Licensed



Comments
Sign in to join the discussion.