🌍 Public
Observable Plot Scatterplot with Color
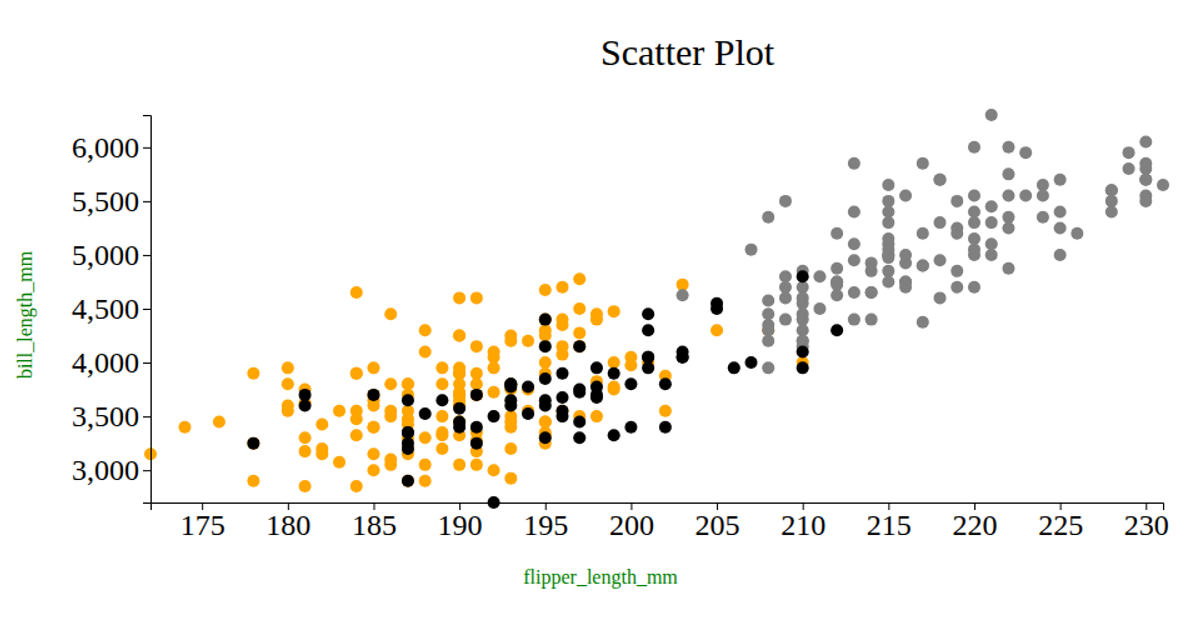
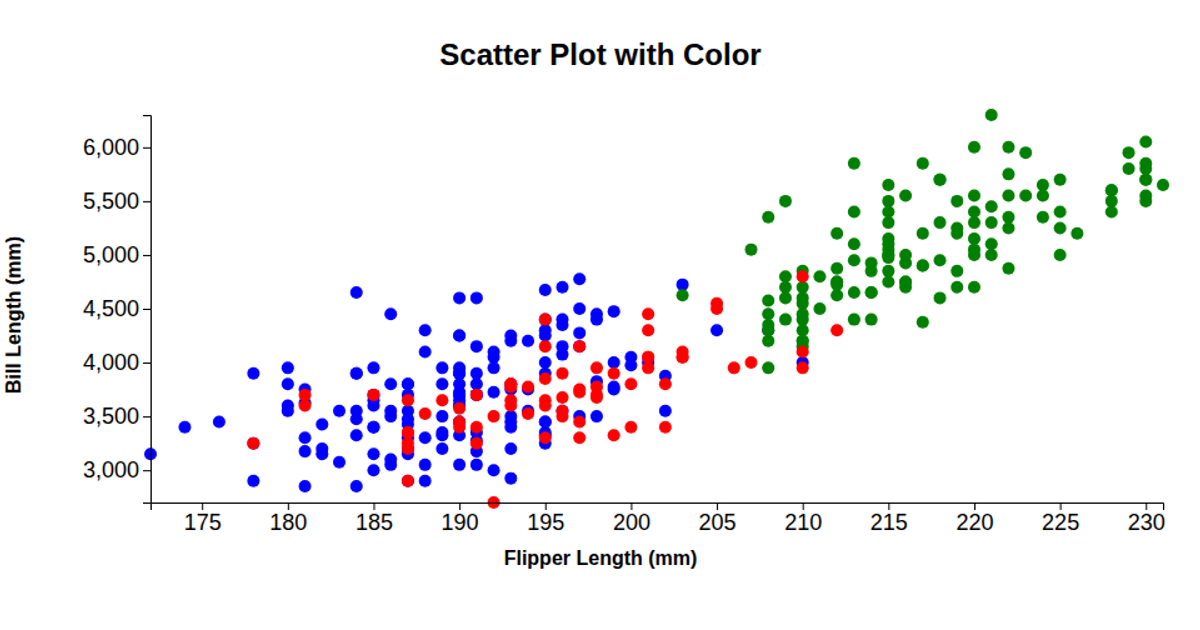
This example shows how penguin body mass and flipper length relate, with points colored by species using the Observable Plot library. It plots the penguins dataset from @curran/penguins, rendering dots with `Plot.dot` and mapping the `stroke` channel to the `species` field, while a legend appears via a `color` option. The chart is sized to its container and includes a grid and inset padding. The code also handles hot reloading by replacing the existing DOM node, and it overrides default figure margins in CSS.
AI-generated descriptionThis example was ported from Observable: Scatterplot with color.
MIT Licensed




Comments
Sign in to join the discussion.