🌍 Public
Observable Plot Scatterplot
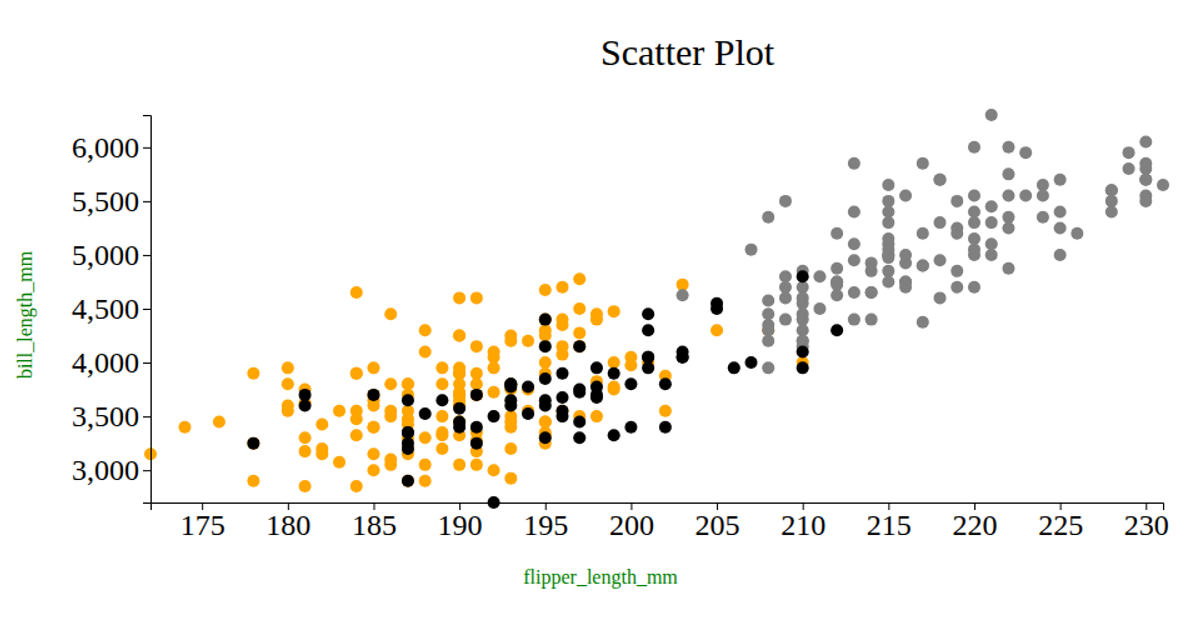
This example uses Observable Plot to render a scatterplot of penguin measurements, with flipper length on the x-axis and body mass on the y-axis. The plot includes a grid, an inset margin, and automatically sizes to fit its container. The code imports the `Plot` library and a penguins dataset, then calls `Plot.plot` with a `Plot.dot` mark to visualize the data.
AI-generated descriptionThis example was ported from Observable: Scatterplot.
MIT Licensed




Comments
Sign in to join the discussion.