🌍 Public
Untitled
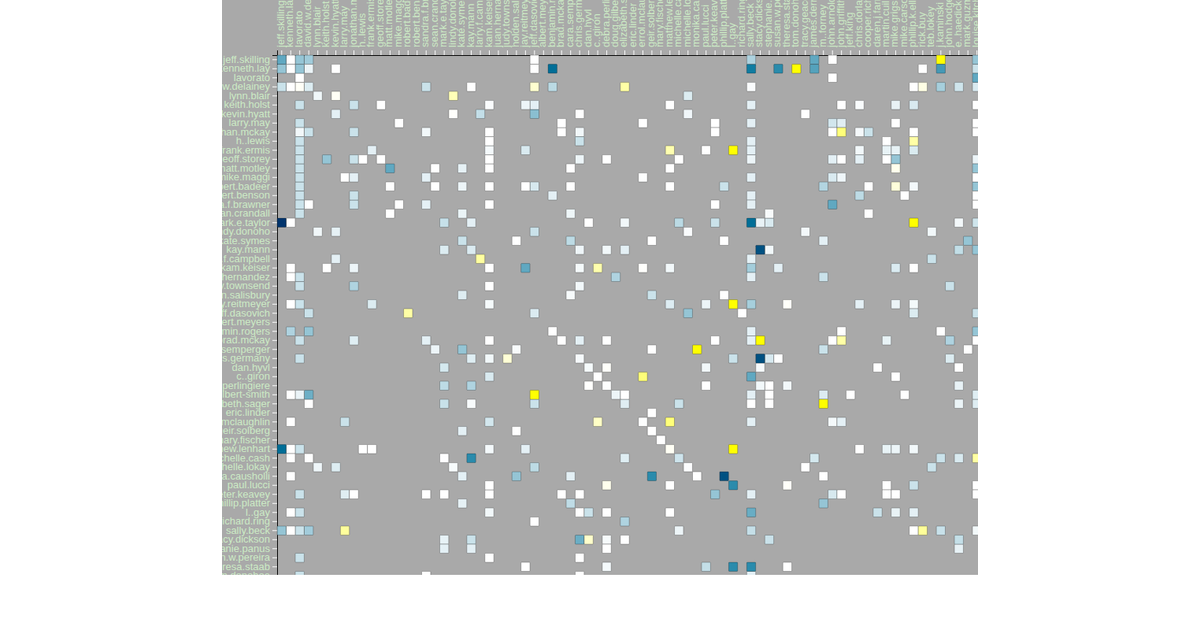
This visualization is an adjacency matrix of email communications within the Enron corpus. Each cell represents the relationship between a sender (fromId) and a recipient (toId), with color indicating the average sentiment of their exchanged messages—orange for negative, white for neutral, and blue for positive. The matrix is rendered as an SVG using d3.v4, with `d3.scaleBand` for both axes, `d3.nest` and `rollup` to aggregate sentiment, and a linear color scale mapping sentiment values. The data comes from a CSV file containing email metadata, dates, and sentiment scores.
AI-generated descriptionMIT Licensed



Comments
Sign in to join the discussion.